Ripple Trades Marginally, Faces Strong Rejection at $1.20 Resistance
Updated: Oct 26, 2021 at 09:27

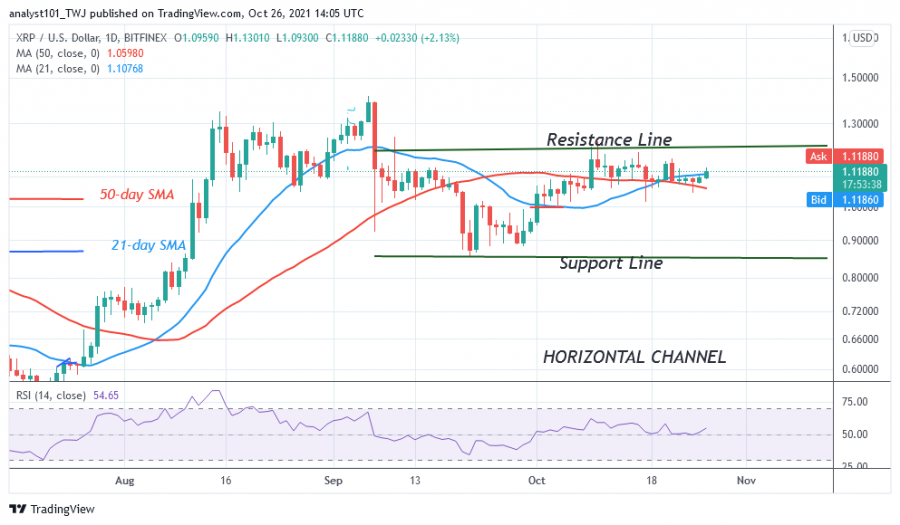
The price of Ripple (XRP) has been consolidating below the $1.20 resistance level. Today, XRP is trading at $1.12 as of press time.
Over the past five days, price action has been stagnant due to the emergence of small body candlesticks called doji and spinning tops. These candlesticks indicate that buyers and sellers are undecided about the direction of the market. Neither buyers nor sellers are driving prices up or down. However, buyers have an advantage over sellers as Ripple is trading in the bullish trend zone. If buyers break through resistance at $1.20, Ripple's price action will accelerate. XRP/USD will regain the previous high of $1.41.
Ripple indicator analysis
XRP is at level 54 of the Relative Strength Index of period 14. The cryptocurrency is in the bullish trend zone and is vulnerable to further upward movement. Currently, the 21-day line SMA and the 50-day line SMA are horizontally sloping, indicating a sideways movement. Ripple will move out of the range-bound movement when the price breaks the resistance line of the horizontal channel and closes above it.

Technical indicators:
Major Resistance Levels - $1.95 and $2.0
Major Support Levels - $0.80 and $0.60
What is the next move for Ripple?
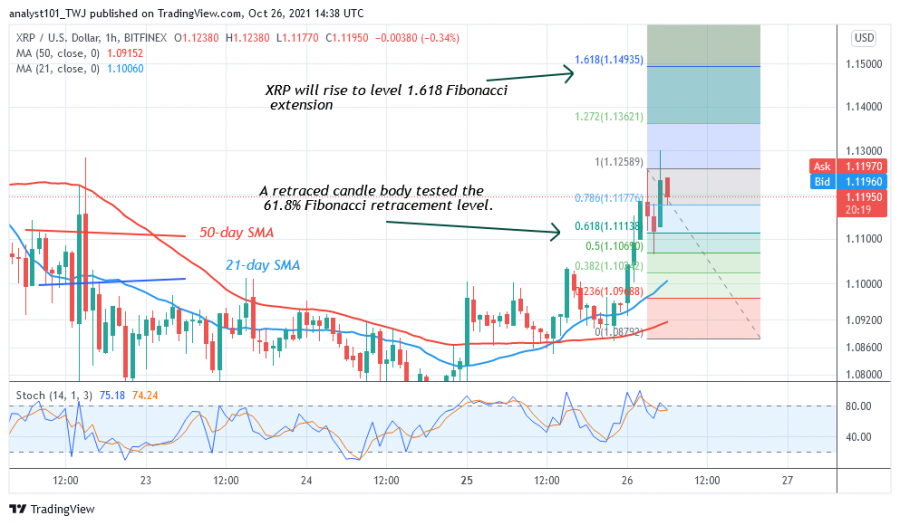
On the 1-hour chart, the XRP price is trading marginally as the price breaks above the moving averages. The cryptocurrency has tested resistance at $1.13 twice and retreated. Meanwhile, the uptrend from October 26 has shown a candle body testing the 61.8% Fibonacci retracement level. The retracement suggests that the XRP price will rise to the Fibonacci extension level of $1.618 or $1.14.

Disclaimer. This analysis and forecast are the personal opinions of the author and are not a recommendation to buy or sell cryptocurrency and should not be viewed as an endorsement by CoinIdol. Readers should do their own research before investing.
Coin expert
Price
Price
News

(0 comments)