Ripple Recovers and Finds Support Above $0.80, Poises for Upward Move

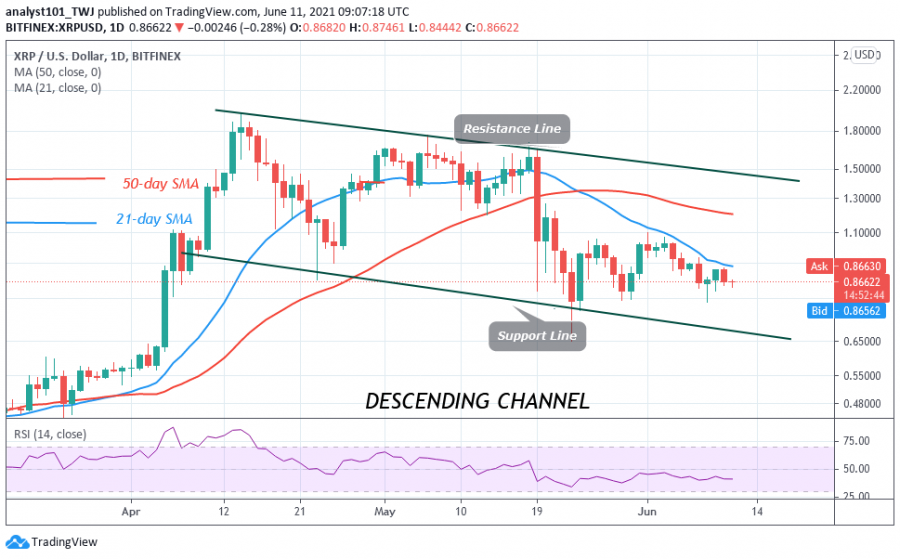
Ripple (XRP) has fallen to $0.86 low as price consolidates above the $0.80 support. For the past week, buyers and sellers appear to reach equilibrium above the current support. The price action is characterized by indecisive small body candlesticks called Doji and Spinning tops.
These candlesticks indicate the indecision between buyers and sellers about the direction of the market. On the upside, the bulls appear to have the upper hand as the price rallied to $1.10 since May 21.
On June 4, the bears took control of the price as XRP plunged to $0.79. Presently, the bulls and bears have reached a balance as the market fluctuates above $0.80 support. Nonetheless, if buyers can push XRP above $1.10, the upside momentum will resume. Ripple will rally to $1.30 or $1.50. Conversely, if the bears break below the $0.80 support, the market will further decline to $0.55 or $0.45 low.
Ripple indicator analysis
XRP/USD is at level 41 of the Relative Strength Index period 14. It indicates that the market is in the downtrend zone and below the centerline 50. The crypto is below the 50% range of the daily stochastic. It indicates that the market is in a bearish momentum. Buyers are likely to emerge in the oversold region.

Technical indicators:
Major Resistance Levels – $1.95 and $2.0
Major Support Levels – $0.80 and $0.60
What is the next move for Ripple?
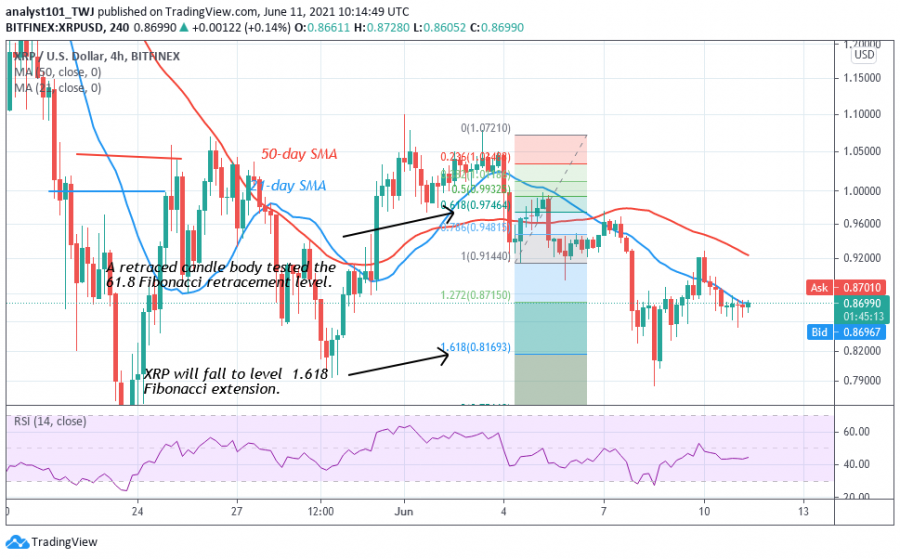
Ripple is in a downward move but it is consolidating above the $0.80 support. Meanwhile, on June 4 downtrend; a retraced candle body tested the 61.8% Fibonacci retracement level. The retracement indicates that Ripple is likely to fall to level 1.618 Fibonacci extension or level $0.8169. From the price action, XRP tested the Fibonacci level but pulled above the $0.80 support. The altcoin has found support and it is consolidating above it.

Disclaimer. This analysis and forecast are the personal opinions of the author are not a recommendation to buy or sell cryptocurrency and should not be viewed as an endorsement by CoinIdol. Readers should do their own research before investing.
Price
PR
Business
Price
Price

(0 comments)