Ripple Is In A Small Retracement And Challenges The High At $0.55
Updated: Mar 31, 2023 at 12:12

The Ripple (XRP) price, which has risen to a high of $0.58, has started an uptrend.
Long-term forecast for the Ripple price: bullish
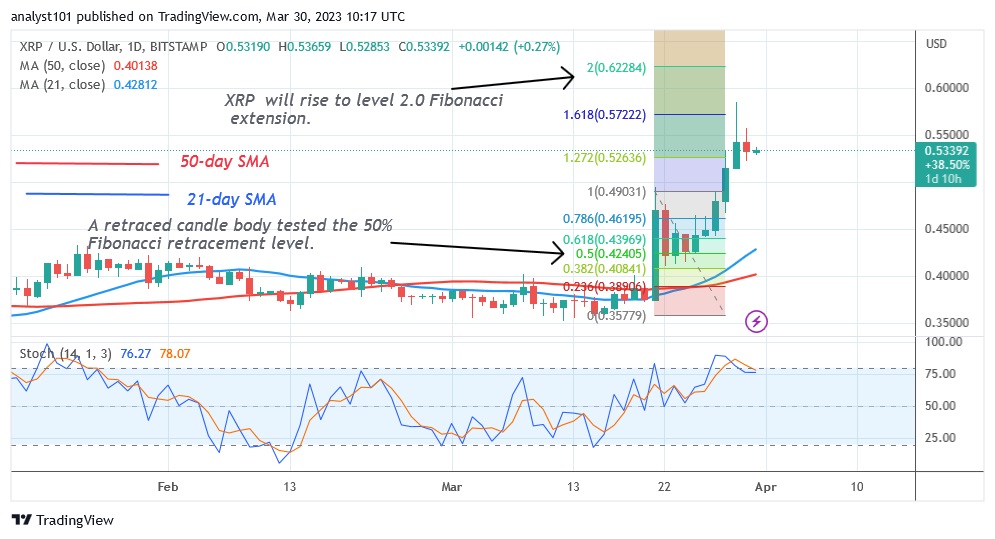
The cryptocurrency asset is now trading at $0.53 after a short retracement. The altcoin returned below the support of $0.55 after reaching a high of $0.58. The price indicator predicts that XRP will rise even further and reach a high of $0.65 if the current barrier level is broken.
On March 21, a candlestick that had previously turned lower attempted to rise to the 50% Fibonacci retracement level. The retracement predicts that XRP will rise to the 2.0 Fibonacci extension level, or $0.62. XRP is currently trading below the $0.55 level based on the price movement. The uptrend will continue once the current resistance level is broken.
Ripple indicator analysis
The relative strength index of the cryptocurrency asset for the period 14 is at 78. The altcoin is heavily overbought and could go down. The position of the price bars above the moving average line has caused the current rise. The downtrend zone is already in place for Ripple. Currently, the daily stochastic is below the 25 level.

Technical indicators:
Key resistance levels - $0.80 and $1.00
Key support levels - $0.40 and $0.20
What is the next step for Ripple?
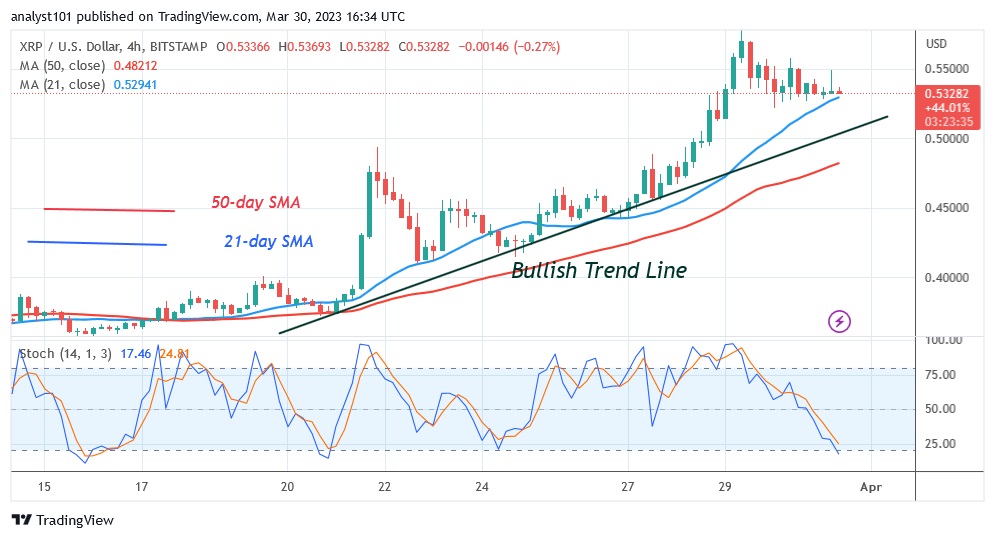
Since the overbought area of the market was rejected, Ripple has been on the retreat. In the shorter time frame, XRP has retreated above the moving average lines. The uptrend will continue if the price stays above the 21-day line SMA. The market is on the verge of being oversold at the moment. Selling pressure is likely to ease on the downside.

Disclaimer. This analysis and forecast are the personal opinions of the author and are not a recommendation to buy or sell cryptocurrency and should not be viewed as an endorsement by CoinIdol. Readers should do their own research before investing
News
Price
Price
Price
Price

(0 comments)