Ripple is in a Downward Correction, Faces Rejection at $0.93
Updated: Dec 10, 2021 at 10:15

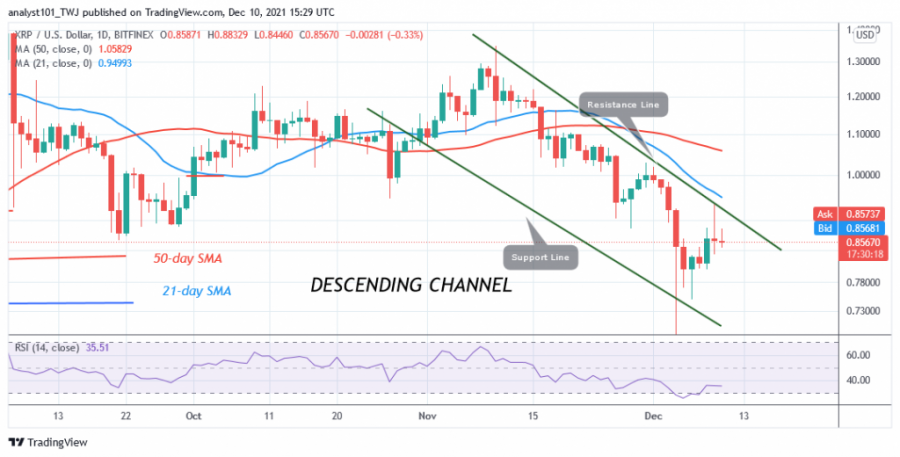
The price of Ripple (XRP) is rallying above support at $0.76. The bears previously dropped XRP to the lows of $0.57, but the bulls bought the dips as shown by the long candlestick.
The rally has stalled. Today, Ripple is facing resistance at $0.93. The altcoin has been rejected twice, as shown by the small-body long wick candlesticks. The long candlesticks indicate that XRP is under heavy selling pressure at higher price levels. The upside move has stalled as sellers resume selling pressure. Bears will try to retake the previous low at $0.76. A break below the current support will send the altcoin down to the low of $0.60.
Ripple indicator analysis
Ripple is at level 33 on the Relative Strength Index for period 14, indicating that the altcoin is in a downtrend and can fall to the downside. The price bars are below the moving averages that are bringing XRP down. The bullish momentum has faded as the bears have taken control of the prices. XRP/USD is below the 50% area of the daily stochastic.

Technical indicators:
Major Resistance Levels - $1.95 and $2.0
Major Support Levels - $0.80 and $0.60
What is the next move for Ripple?
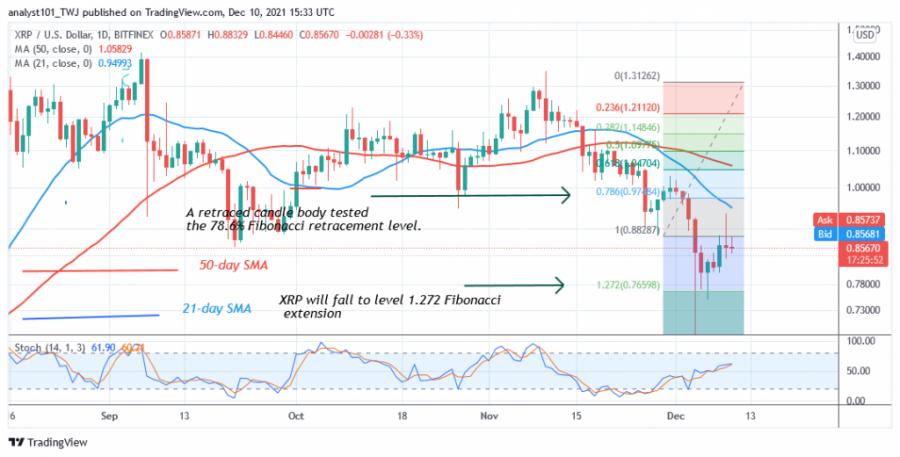
Ripple (XRP) has resumed its downtrend as buyers are unable to sustain the upside. According to the Fibonacci tool, the altcoin will continue to fall. In the downtrend from November 28, a retreating candlestick tested the 78.6% Fibonacci retracement level. The retracement suggests that the XRP price will fall but reverse at the 1.272 Fibonacci extension level or $0.76.

Disclaimer. This analysis and forecast are the personal opinions of the author and are not a recommendation to buy or sell cryptocurrency and should not be viewed as an endorsement by CoinIdol. Readers should do their own research before investing
News
Price
Price
News
Price

(0 comments)