Ripple Recovers above $0.38 as Bulls and Bears Struggle for Price Possession
Updated: May 27, 2022 at 10:38

Yesterday, the price of Ripple (XRP) was on the verge of falling below $0.38 support, but the bulls fought back. Sellers intended to push XRP to the previous low at $0.33.
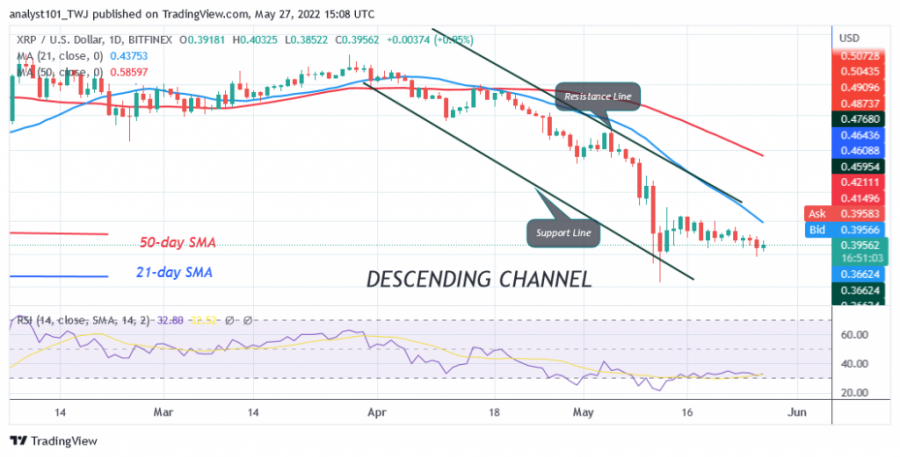
Nonetheless, the long tail of the May 12 candles suggests that the previous low at $0.33 indicates strong buying at lower levels. Today, the altcoin rallied above the $0.38 support. Should XRP rally to the upside, the altcoin is likely to encounter resistance at the high of $0.46 or the 21-day moving average. Nonetheless, XRP will rally to the high of $0.65 if it clears the first hurdle at $0.46. Conversely, if the upward movement fails, the bears will try to push the cryptocurrency below the support of $0.38. Otherwise, the movement will remain in the range between $0.38 and $0.46. At the time of writing, XRP/USD is trading at $0.39.
Ripple indicator analysis
Ripple is at level 33 on the Relative Strength Index for period 14. The RSI is horizontally flat, indicating the sideways trend. The 21-day line SMA and the 50-day line SMA are sloping south, indicating a downtrend. The 21-day moving average line acts as a resistance line for the price bars. XRP is below the 40% area of the daily stochastic. The bearish momentum is unstable.

Technical indicators:
Major Resistance Levels - $0.80 and $1.00
Major Support Levels - $0.60 and $0.40
What is the next move for Ripple?
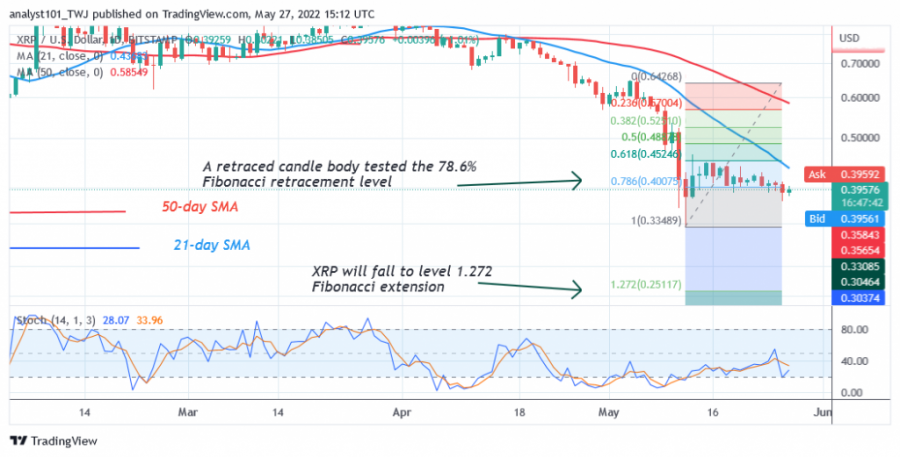
Ripple is in a sideways movement, but sellers are trying to push the altcoin below the $0.38 support. Meanwhile, on May 12 downtrend, a retraced candle body tested the 78.6% Fibonacci retracement level. The retracement suggests that XRP will fall to the level of 1.272 Fibonacci extension or $0.25. The price action shows that XRP continued its movement above the $0.38 support.

Disclaimer. This analysis and forecast are the personal opinions of the author and are not a recommendation to buy or sell cryptocurrency and should not be viewed as an endorsement by CoinIdol. Readers should do their own research before investing
News
Price
News
Price
Price

(0 comments)