Ripple Turns from Overhead Resistance and Holds $0.37 Support

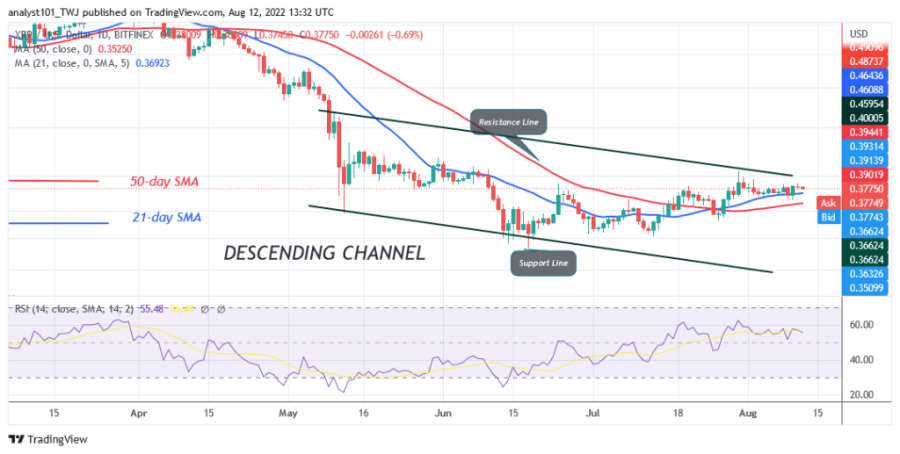
Since July 31, the price of Ripple (XRP) has been bumped off $0.39 overhead resistance. XRP is trading in the bullish trend zone as it consolidates above the moving average lines.
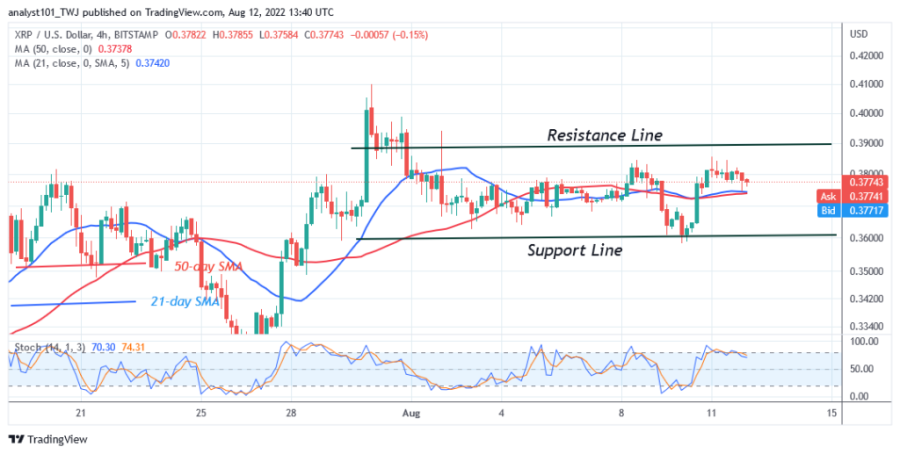
Further upside in the altcoin is doubtful as the price action is dominated by a small indecisive candle called doji. However, if XRP rises back above the 21-day line SMA, the bulls will break through the resistance at $0.39 and $0.41. The cryptocurrency will continue to rise to the highs of $0.46 and $0.49. On the other hand, if the resistances remain unbroken, the XRP will continue to oscillate between $0.36 and $0.39 for a few more days.
Ripple indicator analysis
Ripple is at level 55 of the Relative Strength Index for the period 14. XRP is consolidating in the uptrend zone. The price bars are above the 21-day line SMA and the 50-day line SMA, which gives buyers an advantage to push the crypto higher. The altcoin is below the 80% area of the daily stochastic. The bearish momentum is unstable.

Technical Indicators:
Key Resistance Zones: $0.40, $0.45, $0.50
Key Support Zones: $0.30, $0.25, $0.20
What is the next move for Ripple?
Since the price collapse on July 30, XRP/USD has retreated and started a move between $0.36 and $0.39. The price action is marked by a small indecisive candle called doji. This candle indicates that buyers and sellers have reached a phase of indecision.

Disclaimer. This analysis and forecast are the personal opinions of the author and are not a recommendation to buy or sell cryptocurrency and should not be viewed as an endorsement by CoinIdol. Readers should do their own research before investing.
Price
Price
Price
Blockchain
Price

(0 comments)