Ripple Fluctuates In A Range, But Struggles With High At $0.48
Updated: Apr 28, 2023 at 10:46

The Ripple (XRP) price was trapped between the moving average lines last week.
Long-term forecast for the Ripple price: bearish
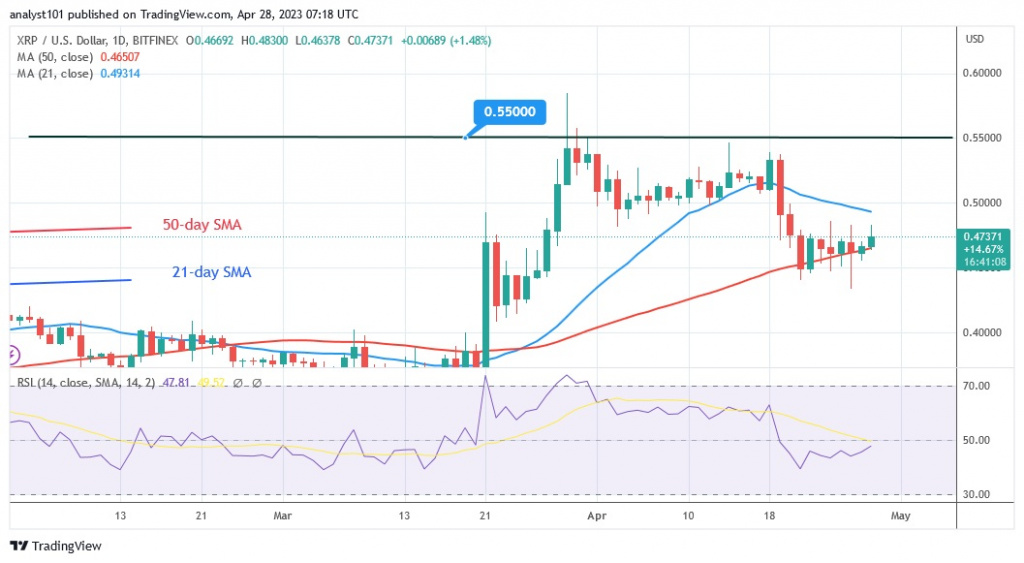
On April 21, the bearish momentum sank above the $0.44 support or the 50-day line SMA. The asset's price is currently above the 50-day line SMA, but below the 21-day line SMA. Last week, the price movement was determined by the moving average lines. At the time of writing, the price of XRP is at 0.47. The altcoin will perform when the moving average lines are broken. For example, if the price of the cryptocurrency exceeds the resistance at $0.50 or the 21-day line SMA, XRP will resume a positive trend. The altcoin will rise above the high of $0.55. Similarly, selling pressure on the altcoin may resume if sellers break either the 0.44 support or the 50-day line SMA. The price of XRP will fall to a low of $0.35.
Ripple indicator analysis
The Relative Strength Index for the 14 period indicates that Ripple is now trading at level 48. The altcoin is trapped between the moving average lines and is in the bearish trend zone. As long as XRP remains between the moving average lines, the sideways movement may continue. The altcoin is currently in a positive momentum as it approaches the overbought zone of the market. The cryptocurrency value is above the daily stochastic value of 80.

Technical indicators:
Key resistance levels - $0.80 and $1.00
Key support levels - $0.40 and $0.20
What is the next move for Ripple?
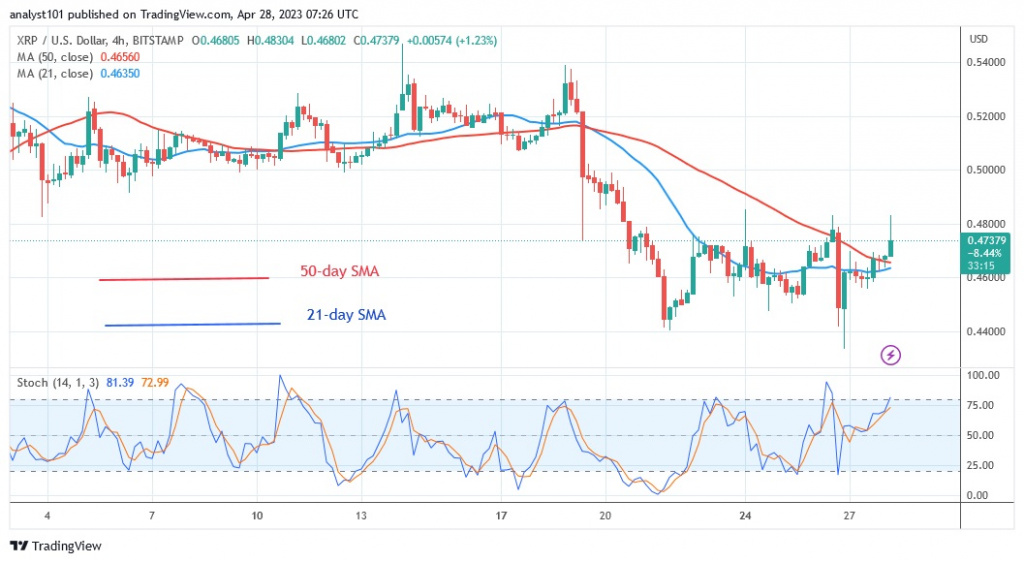
On the 4-hour chart, XRP is trading within a limited range. After finding support above $0.44, the cryptocurrency's price is fluctuating between $0.44 and $0.48. The altcoin will perform when these levels are broken. In the meantime, fluctuations will continue.

Disclaimer. This analysis and forecast are the personal opinions of the author and are not a recommendation to buy or sell cryptocurrency and should not be viewed as an endorsement by CoinIdol. Readers should do their own research before investing
Price
News
Price
Price
Price

(0 comments)