Ripple Falls and is Unable to Push on the Upside, Lacks Buyers at Higher Price
Updated: Jan 21, 2021 at 15:11

Ripple has resumed a downward move after failing to break the resistance at $0.30. The coin has already fallen to a low of $0.278 at the time of writing.
The crypto is likely to fall to the low of $0.26 before resuming upward. Ripple upward move has been hampered by a shortage of buyers at higher price levels. Since January 12, the price has been stuck below $0.31 high. On January 19, buyers attempted to push Ripple to the high of $0.33 but were repelled.
The price fell from $0.33 high to $0.28 low. XRP further declined to $0.27 low after retesting the $0.30 high. Since January 19, the candlesticks are indicating long tails. The long tails indicate that there is strong selling pressure at high price levels. There is the likelihood that XRP will reach a low of $0.26 before a resumption of the uptrend.
Ripple indicator analysis
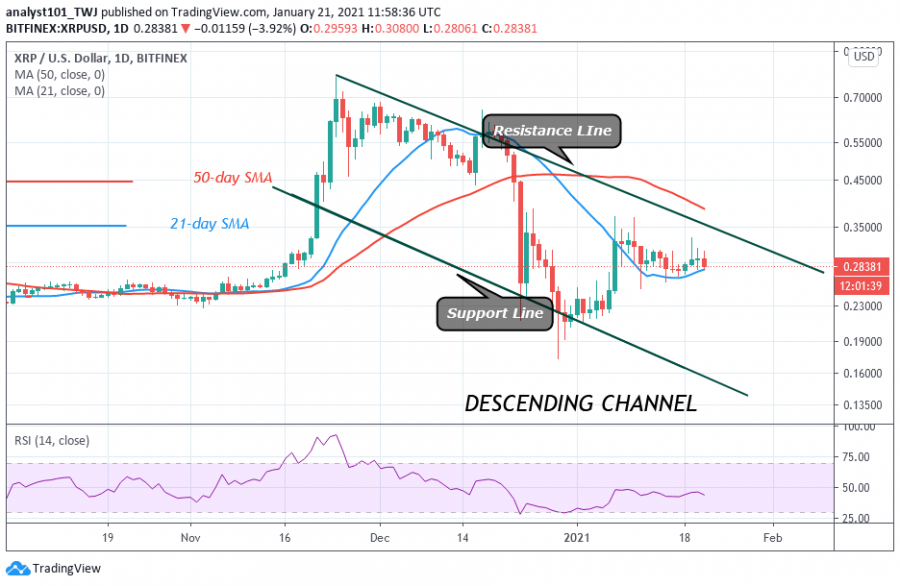
On the daily chart, the price action is characterized by small body candlesticks above the 21-day SMA. The altcoin is likely to be consolidating above the 21-day SMA support. The small body candlesticks indicate that buyers and sellers are undecided about the direction of the market. A break below the 21-day SMA will mean a downward movement of the coin.

Key Resistance Zones: $0.80, $0.85, $0.90
Key Support Zones: $0.20, $0.15, $0.10
What is the next move for Ripple?
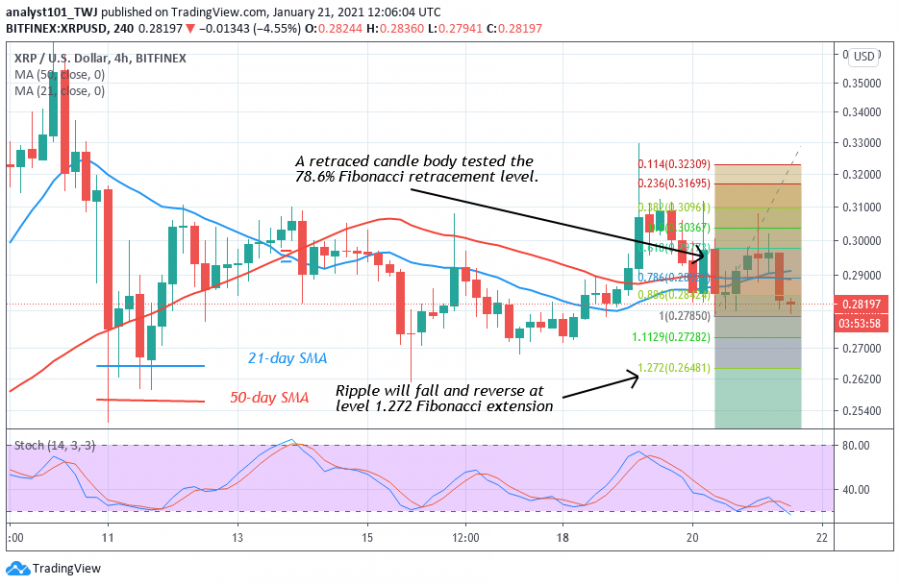
Ripple is on a downward move as bulls fail to break into previous highs. The Fibonacci tool analysis has indicated a downward movement of the coin. On January 20 downtrend; a retraced candle body tested the 78.6 % Fibonacci retracement level. The retracement suggests that Ripple will fall to level 1.272 Fibonacci extension and reverse. That is the low of level $0.264.

Disclaimer. This analysis and forecast are the personal opinions of the author that are not a recommendation to buy or sell cryptocurrency and should not be viewed as an endorsement by CoinIdol. Readers should do their own research before investing
Price
News
Coin expert
Politics

(0 comments)