Ripple Fails to Hold at Higher Levels, Can It Reach the Resistance at $0.31?

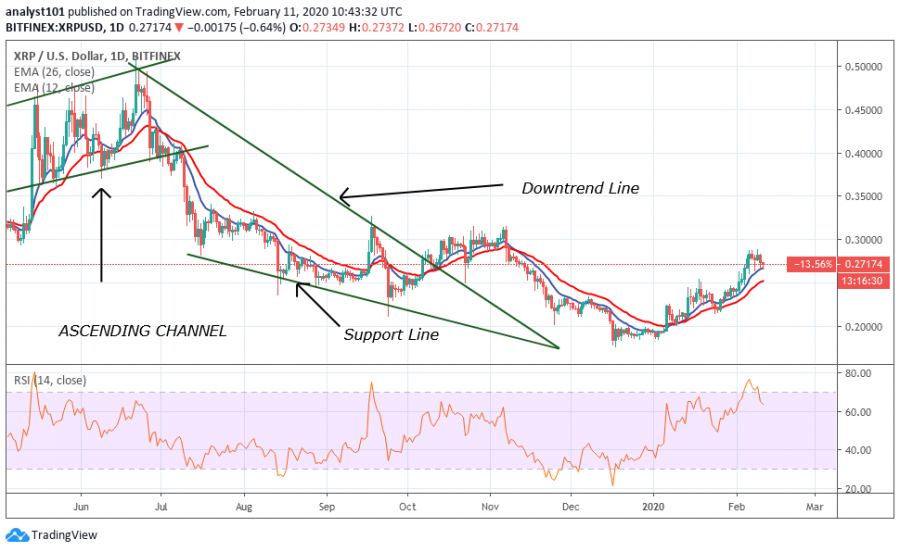
The bulls are yet to trade above the $0.2879 overhead resistance. XRP formed a bearish double top pattern while attempting to break the overhead resistance. The pattern is showing a downward movement of Ripple. Each time the bulls test the resistance, the price will fall exactly to $0.27040 low. One important thing to note is that a break above $0.28 resistance will push XRP over $0.31.
Nonetheless, a sideways move will ensue where the bulls fail to break through the resistance level. XRP is yet to trade above $0.31 price level since July 2019. Meanwhile, XRP has fallen to $0.27040 low on two occasions. A retest at the overhead resistance is probable if this support holds. Conversely, if this support cracks, XRP will drop to a low of $0.25.
Ripple Indicator Analysis
The pair has fallen to a $0.27040 low and is also trading above level 62 of the RSI period 14. On November 6, Ripple was trading at the overbought region of the daily RSI. Buying has been overdone in the region. More so, there were no buyers to push XRP upward. In the interim, XRP is still in the uptrend zone.

Key Resistance Zones: $0.35, $0.40, $0.45
Key Support Zones: $0.25, $0.20, $0.15
What Is the Next Move for Ripple (XRP)?
Ripple has fallen to the support of the 12-day EMA. It explains that as long as the price is over the EMAs, Ripple will continue to rise. The reverse will be the case if the price is beneath the EMAs. Expectantly, we wait for the uptrend to resume as the support holds.
Disclaimer. This analysis and forecast are the personal opinions of the author are not a recommendation to buy or sell cryptocurrency and should not be viewed as an endorsement by CoinIdol. Readers should do their own research before investing funds.
Price
Price
Price
Price
Price

(0 comments)