Ripple Is Range-Bound Between $0.23 and $0.26, a Breakout or Breakdown is Imminent

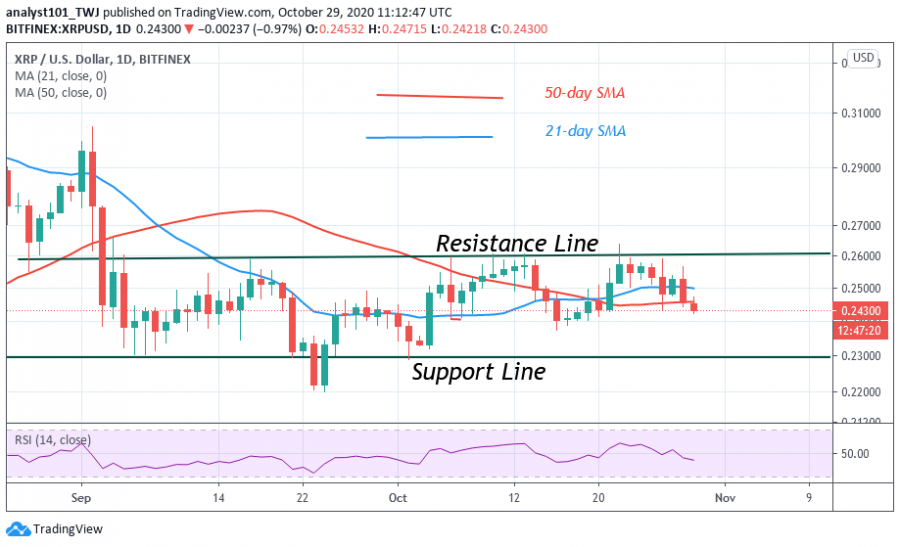
Ripple is range-bound between levels of $0.23 and $0.26. Since September 2, the coin has been fluctuating between $0.22 and $0.26. Nonetheless, on October 2, the price fluctuations narrowed to $0.23 and $0.26. The coin is still on a downward move.
Yesterday, the coin retested the $0.2550 high and dropped to a $0.244 low. Today, selling pressure is ongoing as it retests the $0.2470 high.
Most times, the selling pressure will be exhausted in the middle of the price range or at a low of $0.24. Nevertheless, as Ripple enters a period of consolidation between $0.23 and $0.26, there is the likelihood of a breakout or breakdown. A breakout at a $0.26 high will propel XRP to reach a high of $0.30. Similarly, a break down at $0.23 low will sink XRP further to $0.22 low. Today, XRP has fallen to $0.243 at the time of writing.
Ripple indicator analysis
XRP is at level 44 of the Relative Strength Index period 14. It indicates that XRP is in the downtrend zone and below the centerline 50. The 21-day SMA and 50-day SMA are sloping indicating the sideways movement of the coin.

Key Resistance Zones: $0.35, $0.40, $0.45
Key Support Zones: $0.25, $0.20, $0.15
What is the next move for Ripple?
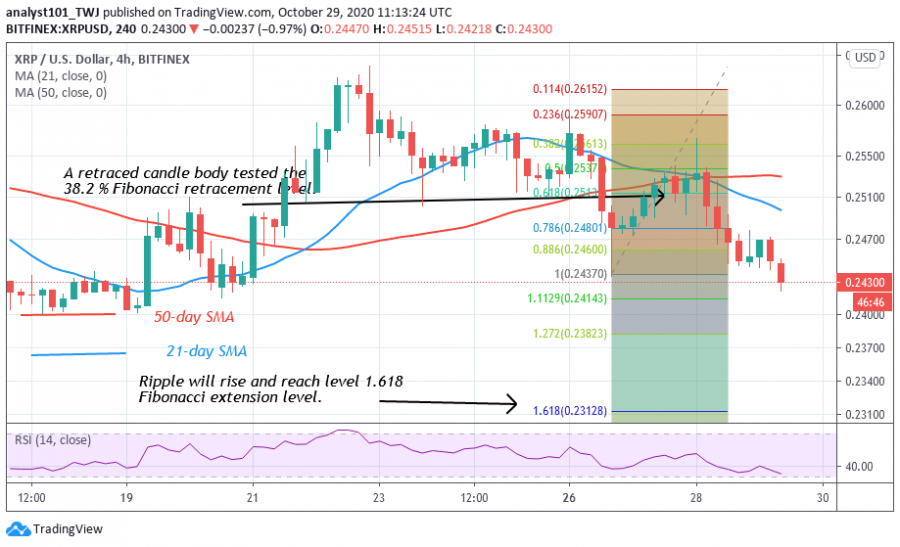
Ripple is on a downward move. On October 26 downtrend; the retraced candle body tested the 61.8% Fibonacci retracement level. This explains that if the current downward move persists the market will reach a low of 1.618 Fibonacci extension level. In other words, the price will reach $0.231low

Disclaimer. This analysis and forecast are the personal opinions of the author that are not a recommendation to buy or sell cryptocurrency and should not be viewed as an endorsement by CoinIdol. Readers should do their own research before investing funds.
Price
Price
Price
Price
Price

(0 comments)