Ripple Is in a Downward Correction, a Breakdown to $0.40 Low Likely

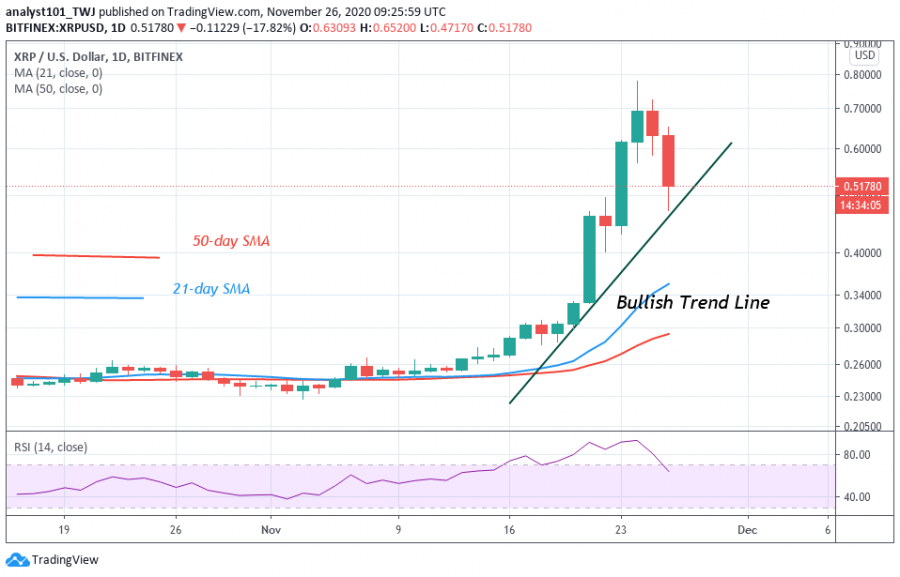
On November 24, Ripple rallied to $0.78 high but pulled back to $ 0.70 low. The altcoin is repeating the price action of September 17, 2018. In that price action, the crypto rallied to $0.79 high.
Presently, buyers could not continue with the upward move because vertical rallies are not sustainable. Besides, the long wick on November 24 suggests strong selling pressure at higher price levels. The coin has already fallen to a low of $0.52 at the time of writing. Nonetheless, there are bullish signals as buyers attempt to hold the current support at $0.52. The upside momentum will resume if the current support holds. The downtrend will resume if the support fails to hold. In other words, Ripple will further decline to $0.40 low.
Ripple indicator analysis
The altcoin has fallen to the support of the trend line. On the downside, if price breaks below the trend line, selling pressure will resume. Besides, the bullish trend may be terminated. Meanwhile, the coin has fallen to level 65 of the Relative Strength Index period 14. XRP was earlier in the overbought region of the market. It indicates that XRP is in the uptrend zone and above the centerline.

Key Resistance Zones: $0.35, $0.40, $0.45
Key Support Zones: $0.25, $0.20, $0.15
What is the next move for Ripple?
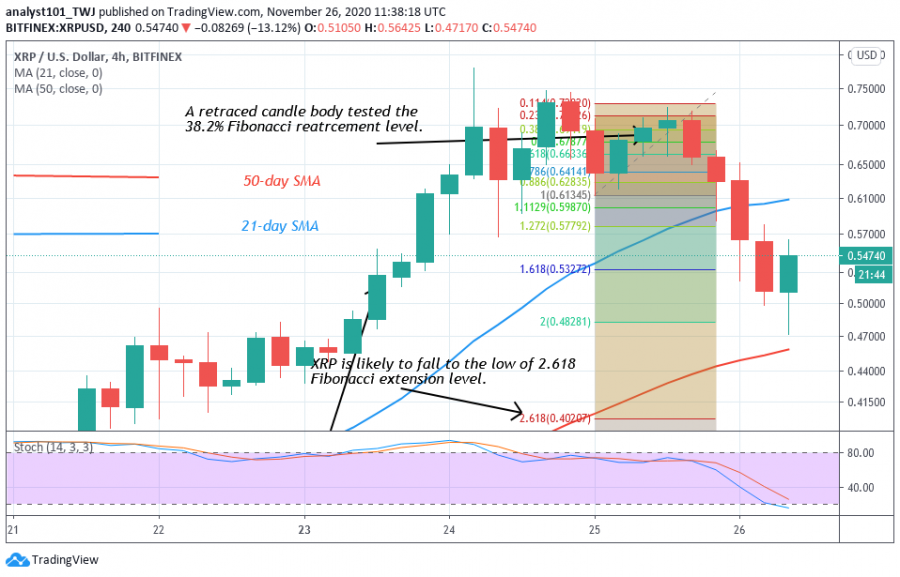
Ripple is in a downward move. Presently, the coin has fallen to a low of $0.52. If price breaks below $0.52 support, the Fibonacci tool analysis is likely to hold. On November 24 downtrend; XRP was rejected at the $0.78 high. The retraced candle body tested the 38.2% Fibonacci retracement level. This implies that the coin will fall and reach level 2.618 Fibonacci extensions or the low of $0.402 low.

Disclaimer. This analysis and forecast are the personal opinions of the author that are not a recommendation to buy or sell cryptocurrency and should not be viewed as an endorsement by CoinIdol. Readers should do their own research before investing funds.
Coin expert
News
Price
Price
Price

(0 comments)