Rippl Recovers And Heads For The High At $0.40
Updated: Jan 13, 2023 at 11:00

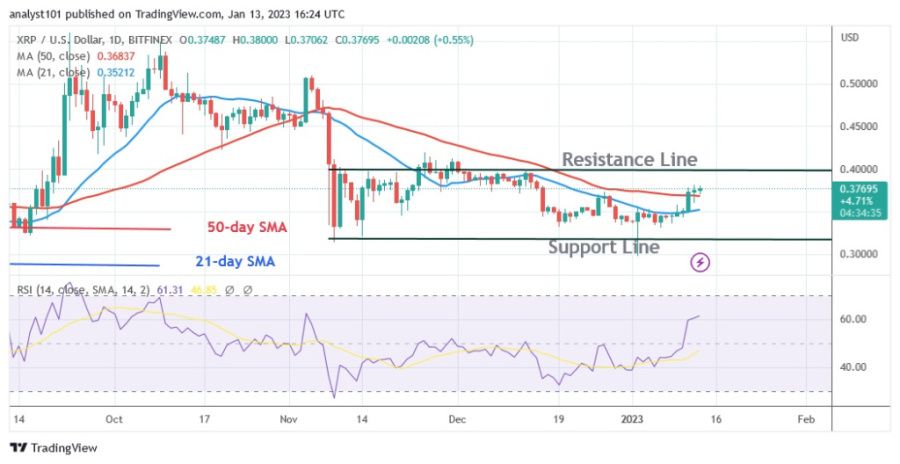
Ripple (XRP) rises when it crosses above the moving average lines. The value of the cryptocurrency asset increased from $0.34 to $0.37.
Long-term forecast for Ripple price: bullish
As long as the price bars are above the moving average lines, the altcoin is expected to rise. XRP will rise and retest the high at $0.40. The $0.40 resistance level has been retested five times by the cryptocurrency price, but it has not been breached yet. The bullish momentum will most likely continue today and reach a high of $0.40. However, the presence of doji candlesticks has caused the price action to remain sluggish.
On the positive side, XRP will rise above the high of $0.40 if it recovers as it did in the last instance. Nevertheless, in areas where the positive trend is maintained, XRP will reach a high of $0.50 or $0.54. The altcoin is expected to move in a narrow range between $0.31 and $0.40 if resistance is broken.
Ripple indicator analysis
For the 14 period, XRP is at level 60 on the Relative Strength Index. The current price increase has caused the RSI to rise recently. It will move upwards as the price bars are above the moving average lines. The altcoin is overbought on the daily stochastics and is above the level of 80. According to this, the market has reached the overbought zone. A success of the uptrend is likely.

Technical indicators:
Key resistance levels - $0.80 and $1.00
Key support levels - $0.40 and $0.20
What is the next step for Ripple?
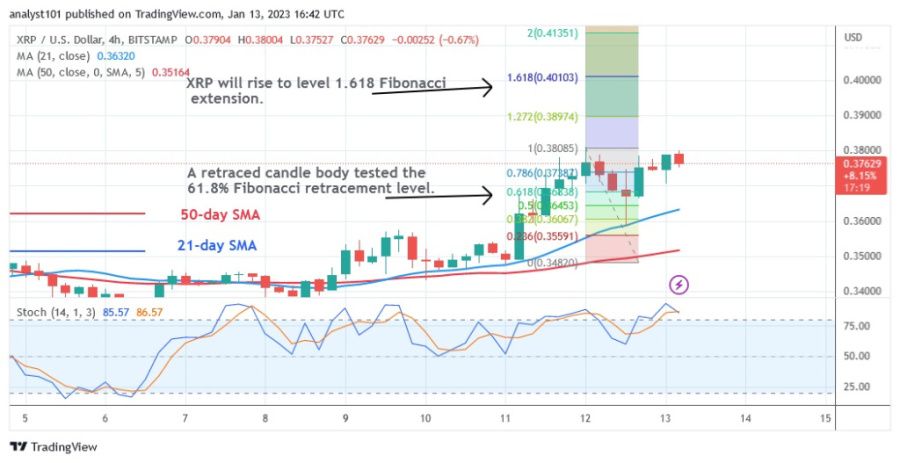
After a recent price recovery, Ripple (XRP) is moving up within the positive trend zone. As long as the price bars are above the moving average lines, Ripple will continue to rise. A bearish candlestick body of the January 12 uptrend has tested the 61.8% Fibonacci retracement line. According to the retracement, XRP will rise to the 1.618 level of the Fibonacci extension or $0.40.

Disclaimer. This analysis and forecast are the personal opinions of the author and are not a recommendation to buy or sell cryptocurrency and should not be viewed as an endorsement by CoinIdol. Readers should do their own research before investing
News
Price
Price
News
Price

(0 comments)