Quant Is In An Uptrend And Targets The High Of $92

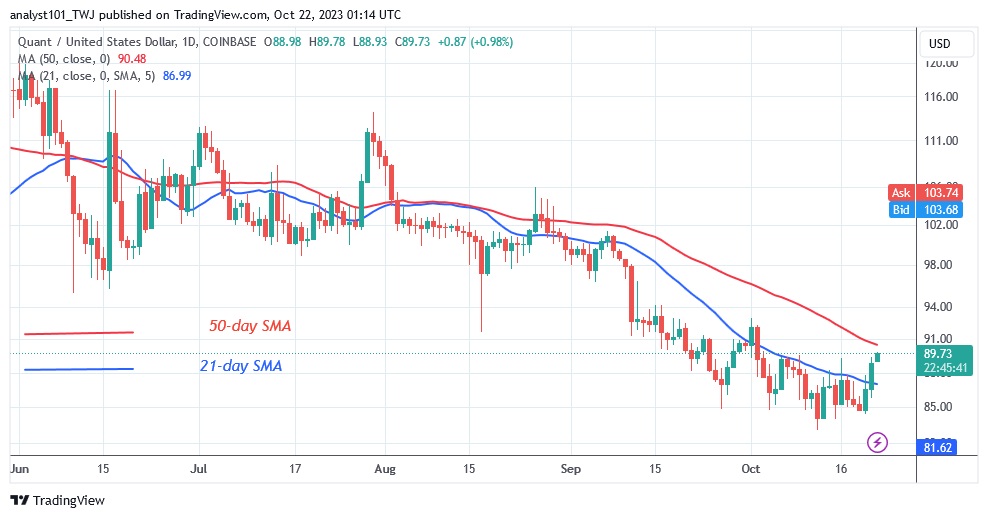
Cryptocurrency analysts of Coinidol.com report, the price of Quant (QNT) is rising from the bottom of the chart after breaking the 21-day barrier line of SMA.
Quant long term price forecast: bearish
The crypto asset is now trading above the 21-day simple moving average, but below the 50-day simple average. At the time of writing, the altcoin had reached a high of $89. If the bulls break the 50-day line SMA and the resistance at $94, QNT will resume its uptrend. The altcoin will reach a high of $114. However, the price's uptrend has been encountering resistance at $114 since May. If the altcoin finds support above the 21-day line SMA, it will resume its movement between the moving average lines. Quant is currently trading between the moving average lines.
Quant price indicator analysis
QNT has broken out above the 21-day resistance line SMA. The altcoin will oscillate between the moving average lines as long as the price bars remain stuck. As the price bars are above the moving average lines in the lower time frame, the cryptocurrency is rising. The moving average lines are down even though the altcoin has regained bullish momentum.

Technical indicators
Key supply zones: $140, $150, $160
Key demand zones: $90, $80, $70
What is the next move for Quant?
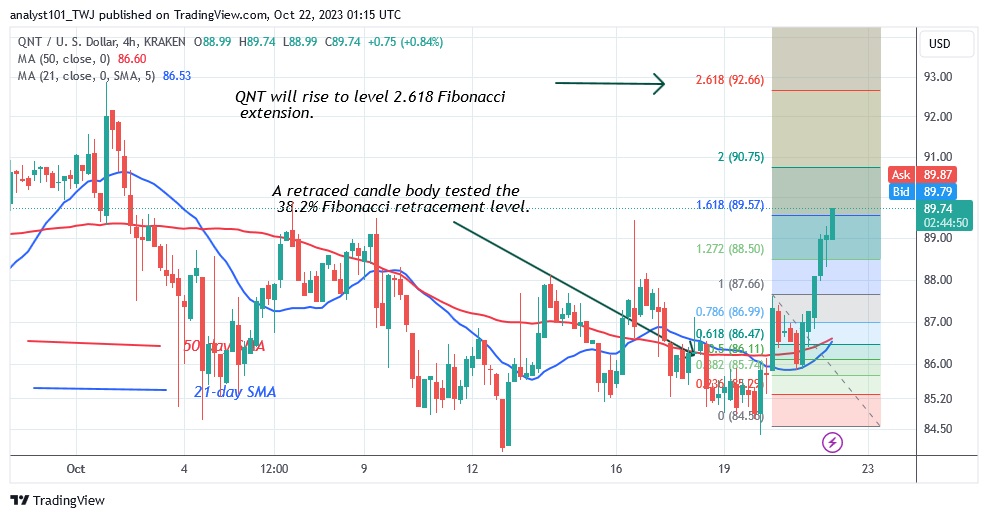
QNT/USD is in a positive trend as it breaks above the moving average lines. It is predicted that the cryptocurrency will rise much further than its previous high. The Fibonacci tool predicts that QNT will grow to the level 2,618 Fibonacci extension or $92.66. The altcoin will return to the historical price level of October 1. However, further upward movement of the altcoin is speculative as the market is approaching the overbought zone.

On October 14, 2023 cryptocurrency analytics specialists of Coinidol.com stated that selling pressure is currently easing above the $85 support. The altcoin's price has been hovering between $85 and $93 since September 26, but the 21-day line SMA has been holding back the higher price action.
Disclaimer. This analysis and forecast are the personal opinions of the author and are not a recommendation to buy or sell cryptocurrency and should not be viewed as an endorsement by CoinIdol.com. Readers should do their research before investing in funds.
Price
Price
News
Price
Price

(0 comments)