Quant Remains Stuck At $130 After The Last Drop

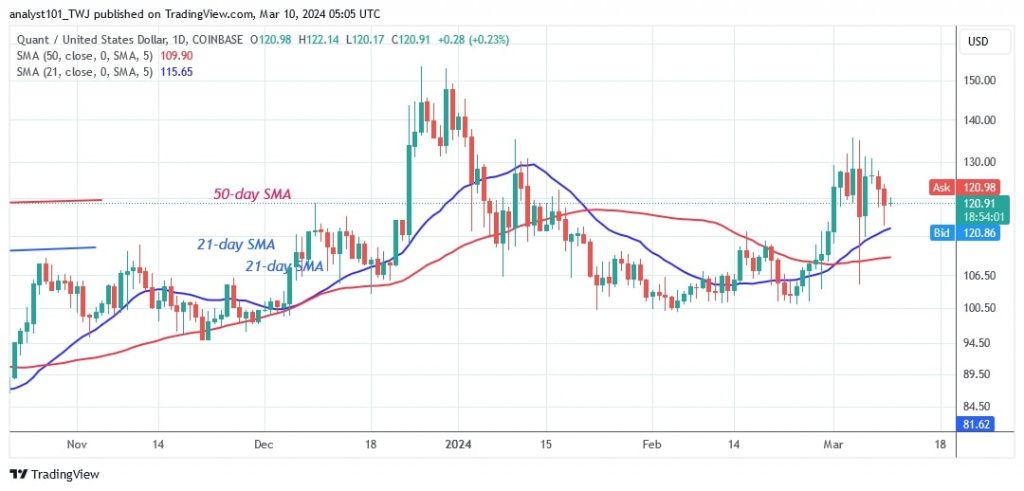
The price of Quant (QNT) is trading above the moving average lines but remains stuck at its high of $130. Quant price analysis by Coinidol.com.
Long-term forecast for the Quant price: bullish
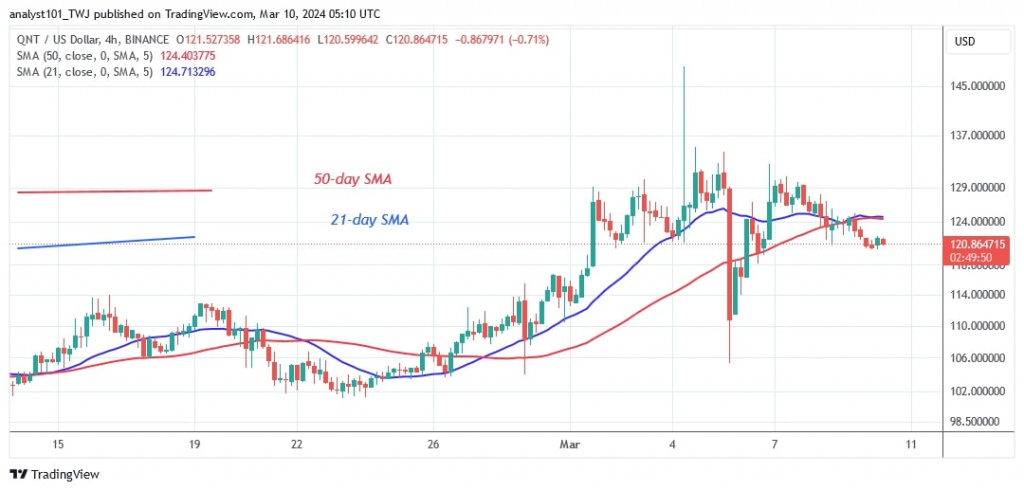
Since March 1, 2024, the bulls have been working feverishly to sustain the upside momentum above the current high. On March 5, the altcoin climbed to a high of $134 before being beaten back. QNT quickly fell below the moving average lines and reached a low of $104. The bulls bought the dips as the altcoin climbed back above the moving average lines. At the time of writing, QNT is now worth $121.23.
Further upward movement seems unlikely. The extended candlestick wicks signal strong selling pressure at $130. QNT will fall to a low of $101 if the bears break the moving average lines.
Analysing the quant price indicators
On the 4-hour chart, the price bars have moved below and above the horizontal moving average lines. The lowest time frame represents the current sideways trend. On the daily chart, the price bars have remained static above the moving average lines, indicating that the altcoin is trapped in a range.
Technical Indicators
Key supply zones: $140, $150, $160
Key demand zones: $90, $80, $70

What is the next development for Quant?
QNT has been trading in a range since March 1, 2024. After the recent drop, the altcoin is currently trading between $100 and $130. The altcoin will regain momentum if the $130 barrier is broken. QNT will reach highs between $140 and $150. QNT is currently trading in a modest range.

Disclaimer. This analysis and forecast are the personal opinions of the author and are not a recommendation to buy or sell cryptocurrency and should not be viewed as an endorsement by CoinIdol.com. Readers should do their research before investing in funds.
News
Coin expert
News
Price
Price

(0 comments)