Quant Price Falls Back To $120 Due To Persistent Rejection

Quant (QNT) continues to trade sideways below the $120 mark.
Long-term forecast for Quant price: range
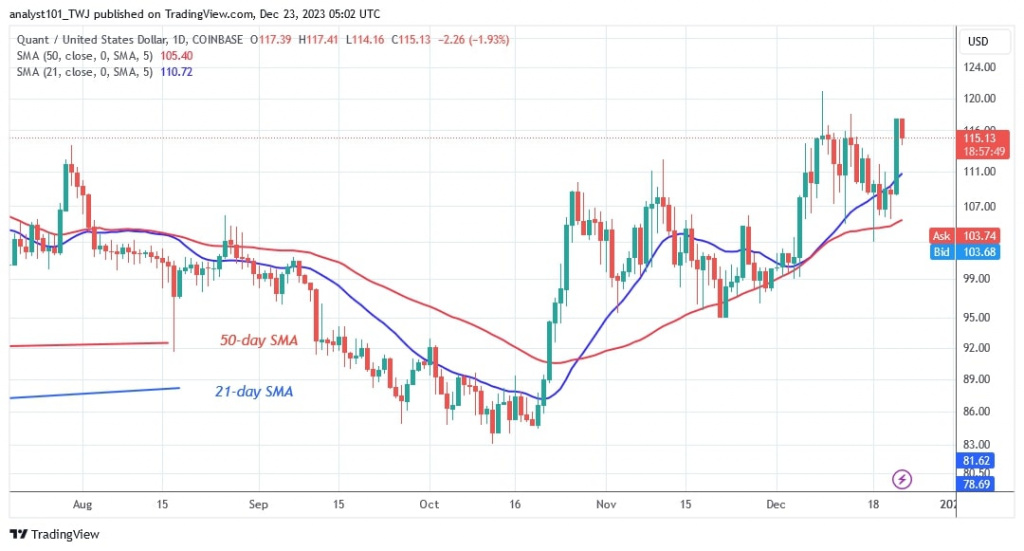
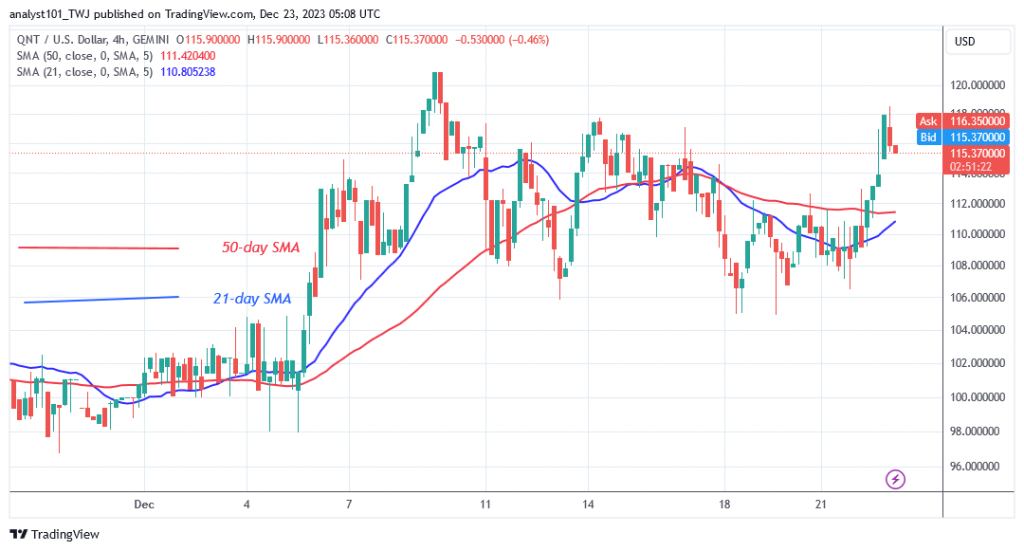
Previous price action has shown that the market is in an upward correction as the cryptocurrency recovers from its earlier downturn. The upward movement has been halted three times by resistance at $120. The altcoin's inability to reach the previous high has prompted it to resume a sideways trend below the resistance zone at $120. Quant is at $115 at the time of writing.
On the positive side, a break of the $120 resistance level will see the altcoin rise to a high of $150. On the other hand, Quant will widen its trading range if it fails to break the resistance at $120.
Analysis of the Quant Price Indicator
The price bars are leaning to the left and right of the moving average lines. The price is currently above the 21-day SMA, which allows the altcoin to rise. If the price bars fall below the moving average lines, the cryptocurrency will fall. The long wick of the candle at the recent high indicates that there is significant selling pressure at the higher price level.
Technical indicators
Important supply zones: $140, $150, $160
Important demand zones: $90, $80, $70

What is the next development for Quant?
Since December 9, the price of QNT/USD has been stuck below the $120 resistance level. The altcoin is currently trading in a range of $106 to $120. Once the current resistance is broken, the cryptocurrency value is likely to rise. Further declines in the cryptocurrency are unlikely.
Disclaimer. This analysis and forecast are the personal opinions of the author and are not a recommendation to buy or sell cryptocurrency and should not be viewed as an endorsement by CoinIdol.com. Readers should do the research before investing in funds.
News
Price
Price
News
News

(0 comments)