Quant Initiates Further Decline As It Meets With Rejection At $104

The price of Quant (QNT) is bearish, but is in an upward correction.
Quant long term price forecast: bearish
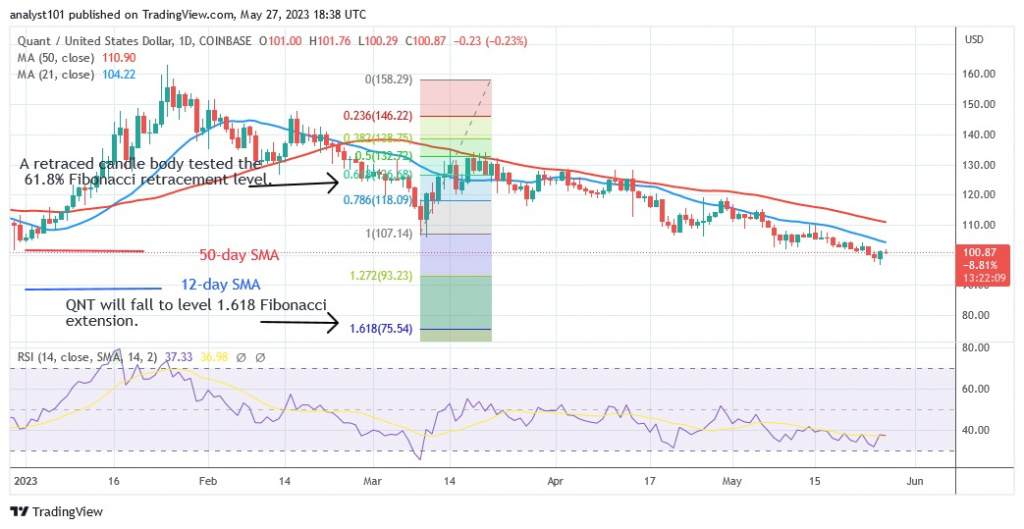
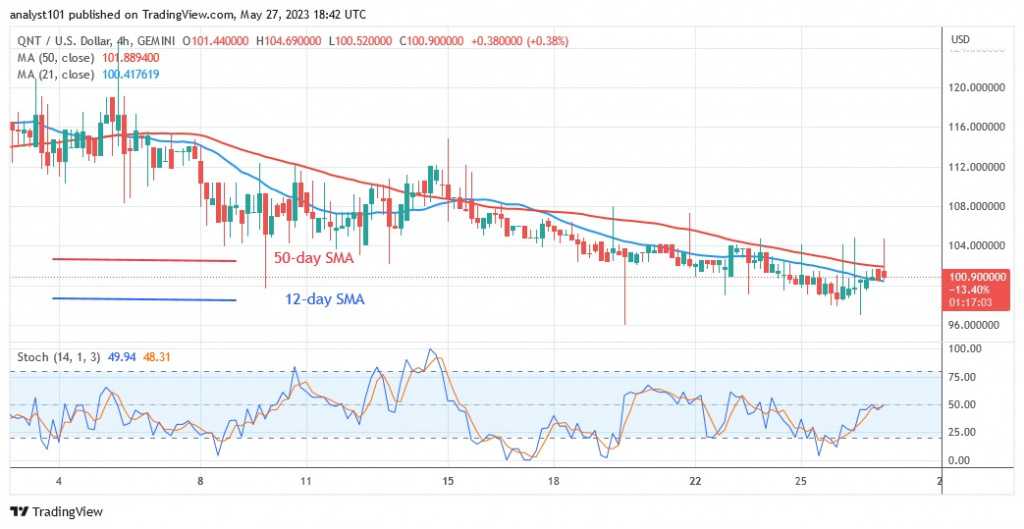
Upside is limited below the moving average lines. QNT will continue to fall as long as the price bars are below the moving average lines. Bullish momentum is rising above the moving average lines, but falling between them in the lower time frame. The altcoin will be driven into a range-bound move before selling pressure resumes. QNT is currently trading at $100.73. The cryptocurrency will continue to lose value and reach a low of $75, as suggested by the current price indicator. In other words, QNT will fall to the Fibonacci extension at 1.618.
Quant price indicator analysis
QNT is at level 37 on the Relative Strength Index for the period 14. The alternative currency is in a bearish trend zone and will continue to fall. The moving average lines are below the price bars, indicating a further decline. The altcoin is in an uptrend when the daily stochastic threshold of 40 is exceeded. The pace of the development has slowed down.

Technical Indicators
Key supply zones: $140, $150, $160
Key demand zones: $120, $110, $100
What is the next step for Quant?
Quant continues to move below the moving average in a bearish direction. As long as the price bars are below the moving average lines, the trend will remain bearish. The decline will be minimal as long as the Doji candlesticks control the price movement.

Disclaimer. This analysis and forecast are the personal opinions of the author and are not a recommendation to buy or sell cryptocurrency and should not be viewed as an endorsement by CoinIdol. Readers should do their own research before investing in funds.
Price
Price
Price
News
Price

(0 comments)