Quant Reaches The $72 Low And Could Fall Further

The price of Quant (QNT) has fallen and is in a sideways trend. In the recent price action, the altcoin corrected upwards but was dumped at the high of $140.
Long-term Quant price prediction: bearish
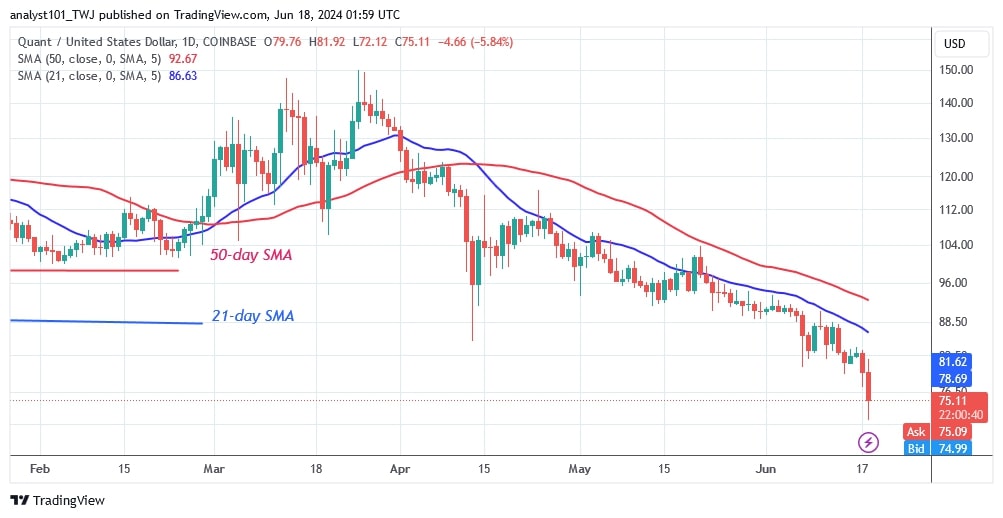
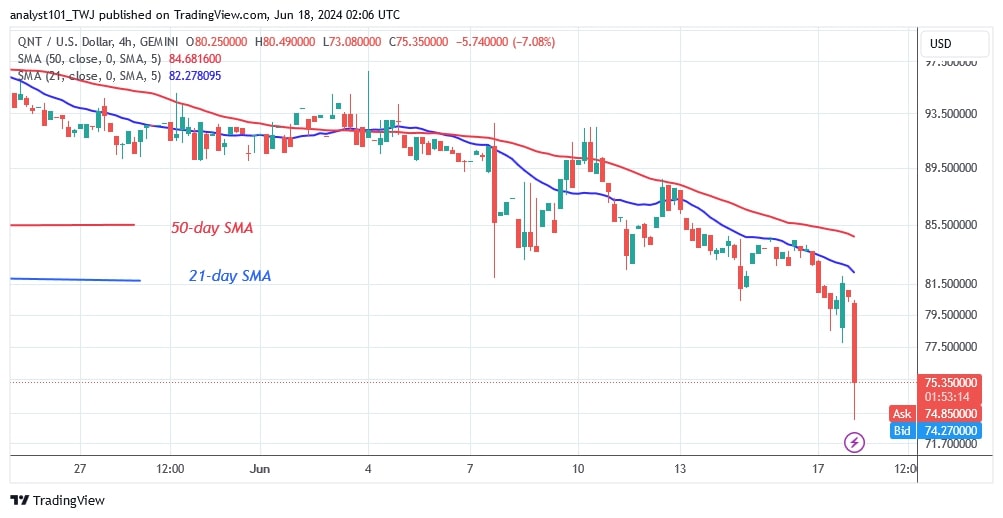
Today, June 18, 2024, the downtrend has continued as the altcoin fell to a low of $72. QNT fell to a low of $72, but is fluctuating above the current support again. Currently, the altcoin is trading between the $72 support and the $76 resistance.
Should the bears break the existing support to the downside, selling pressure will increase again. The market will fall and reach its previous low of $40 again. On the upside, the uptrend will resume if the buyers sustain the price above the moving average lines or the $104 level. The altcoin is currently valued at $76.
Analysing the Quant price indicators
Quant prices have fallen as the moving average lines have slowed to the south. The 21-day SMA has provided resistance to the price bars. If the price of the altcoin crosses above the moving average lines, it will move higher. Currently, the altcoin is on its way down as the price bars remain below the moving averages.
Technical indicators
Important supply zones: $140, $150, $160
Important demand zones: $90, $80, $70

What is the next move for Quant?
Quant falls below the moving average lines as the cryptocurrency returns to the bottom of the chart. If the bears break the $72 support level, selling pressure will pick up again. Likewise, if the buyers push the price above the moving averages, the uptrend will begin.

Disclaimer. This analysis and forecast are the personal opinions of the author and are not a recommendation to buy or sell cryptocurrency and should not be viewed as an endorsement by CoinIdol.com. Readers should do their research before investing in funds.
Price
Price
Price
Price
News

(0 comments)