Polygon Drops As It Reaches An Overbought Region At $0.68

Cryptocurrency analysts of Coinidol.com report, the price of Polygon (MATIC) has declined since the price spike on July 13.
Long-term forecast of the price of Polygon: bearish
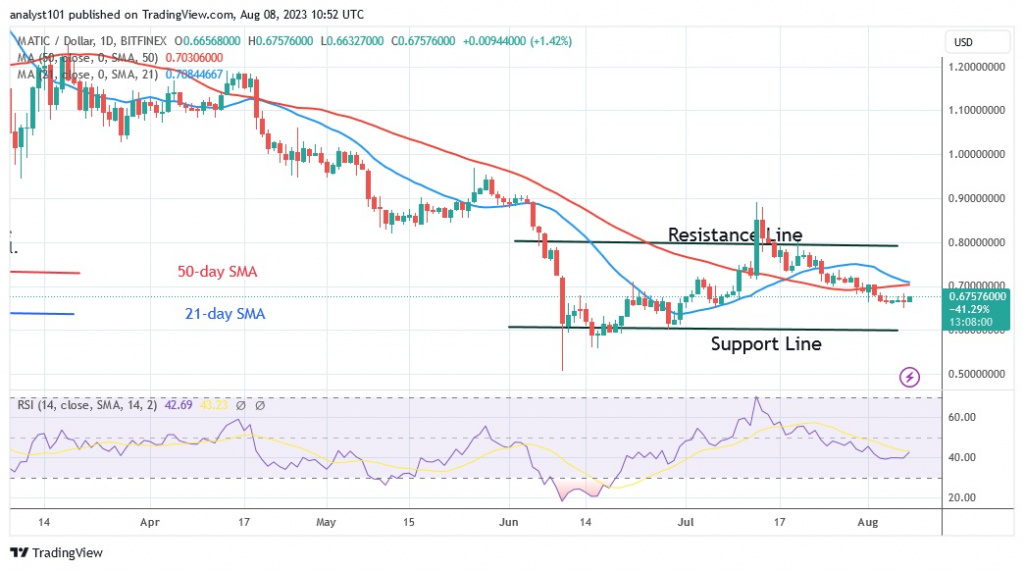
The altcoin experienced a bearish exhaustion on August 7 at a low of $0.647. Before rejecting the last high on July 13, buyers tried to resume an uptrend. The altcoin is currently trading at $0.67 as the bulls bought the dips.
After the price drop on June 10, the cryptocurrency is currently stuck in a range. Polygon's price range has been capped at $0.60 to $0.80. If buyers keep the price above the moving average lines and the resistance at $0.80, the altcoin will resume its uptrend. The cryptocurrency will remain capped at the bottom of the chart if buyers fail to break the recent high.
Polygon indicator analysis
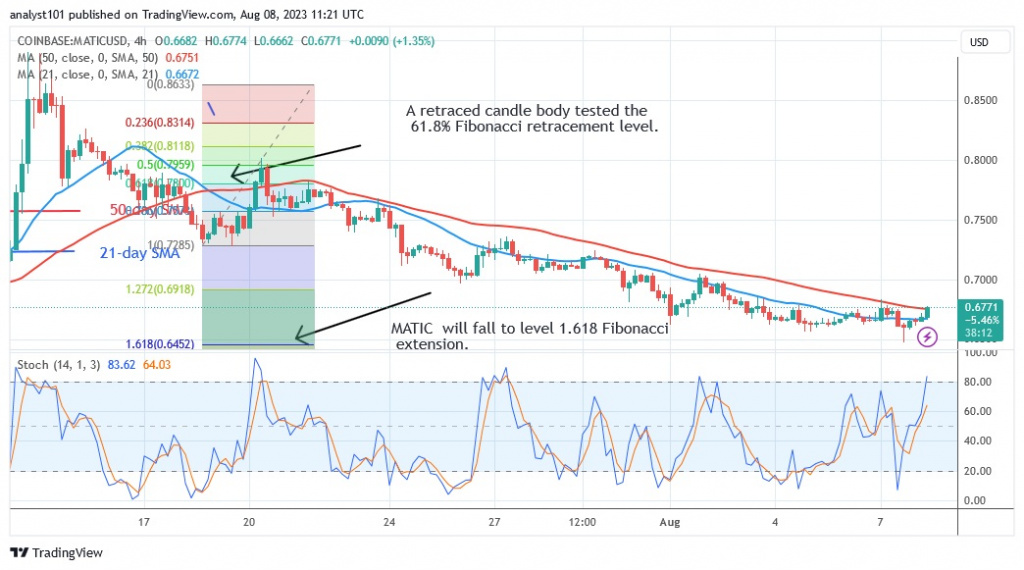
Polygon has reached the bearish exhaustion of the Relative Strength Index of period 14 at level 39. The MATI C remains in the downtrend zone. The price bars are correcting upwards and are below the moving average line. The altcoin has entered an overbought area of the market. It is above the daily stochastic value of 76. In the overbought region, the altcoin is likely to be sold off.

Technical indicators
Resistance levels: $1.20, $1.30, $1.40
Support levels: $0.60, $0.40, $0.30
What is the next step for Polygon?
Polygon is currently in a narrow range between $0.66 and $0.68. The price movement has been limited to a small range since August 4. Today, the uptrend is encountering resistance at $0.68. In other words, MATIC is currently overbought at $0.68.

On August 02, 2023 cryptocurrency analytics specialists of Coinidol.com stated that the bearish momentum has temporarily subsided as the altcoin's price is moving between $0.60 and $0.80. Moreover, the cryptocurrency's price is trading between the moving average lines as it strives to fall below the 50-day line SMA.
Disclaimer. This analysis and forecast are the personal opinions of the author and are not a recommendation to buy or sell cryptocurrency and should not be viewed as an endorsement by CoinIdol.com. Readers should do their own research before investing in funds.
Price
News
Price
Price
News

(0 comments)