Polkadot Continues Upward Trend And Overcomes Resistance At $6.50

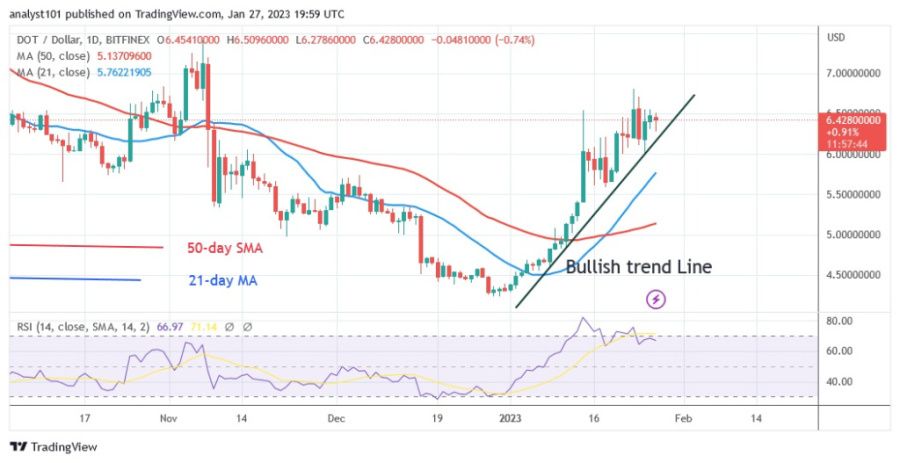
Polkadot (DOT) is in an uptrend and reached a high of $6.81 on January 23. The cryptocurrency asset is expected to reach a high of $7.41.
Polkadot price long-term analysis: bullish
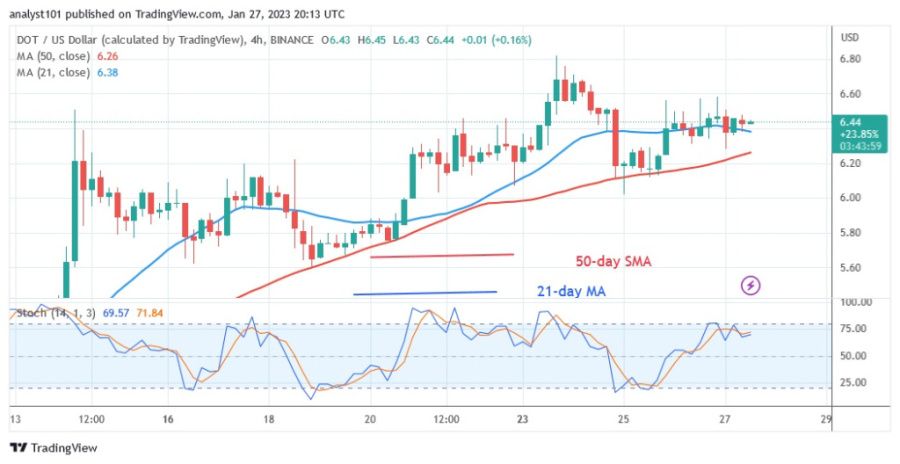
The uptrend was stopped in the last five days as the altcoin oscillates below the $6.50 resistance level. The market became overbought and the altcoin was rejected twice. Thus, the altcoin came under selling pressure on January 14 and 23, when the polkadot moved into the overbought zone. The $6.50 resistance level is currently resisting the upward movement. If the current resistance is broken, the altcoin will meet the following resistance at $7.41. If the altcoin is rejected from the current high, it will eventually fall to its previous low of $5.59.
Polkadot indicator analysis
Polkadot is at the 66 level of the Relative Strength Index for the 14 period and is in the bullish trend zone. When the price bars are above the moving average lines, the altcoin will rise. If the price bars are below the moving average lines, it will fall. Below level 80 of the daily stochastic, Polkadot is in a bearish momentum.

Technical indicators:
Key resistance levels - $10 and $12
Key support levels - $6 and $4
What is the next direction for Polkadot?
Polkadot continues to rise but needs to overcome the $6.50 resistance. If the $6.50 resistance is broken, the uptrend will resume. The price of the altcoin is currently moving between $6.00 and $6.50. However, the overbought condition of the cryptocurrency could hinder its upward movement.

Disclaimer. This analysis and forecast are the personal opinions of the author and are not a recommendation to buy or sell cryptocurrency and should not be viewed as an endorsement by CoinIdol. Readers should do their research before investing in funds.
News
Price
Price
Price
Price

(0 comments)