Polkadot Makes Positive Moves as Buyers Approach the Overbought Region
Updated: Oct 02, 2021 at 10:28

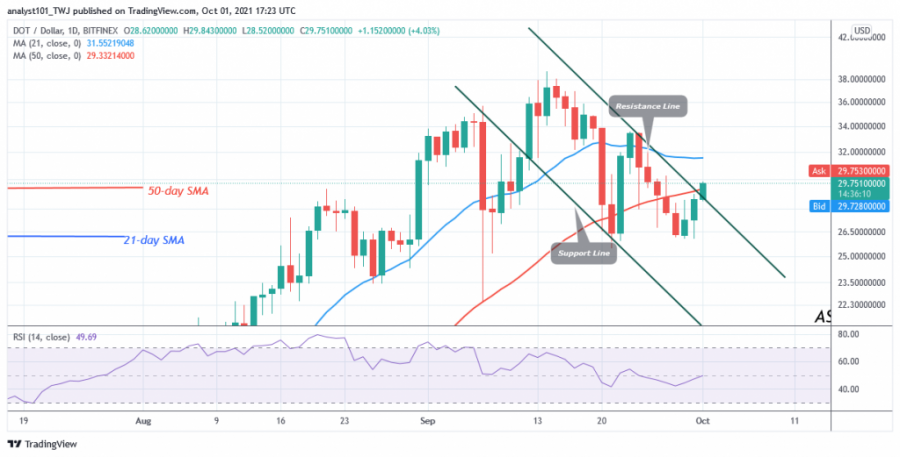
Polkadot (DOT) is making impressive moves as it breaks out above the 50-day line SMA. Today, the altcoin's price hit a high of $29 after rising above its moving average.
The bullish momentum is likely to continue and if the price breaks above the 21-day line SMA, Polkadot will be trading in the bullish trend zone.
At the same time, the altcoin will move out of the downward correction. If the bulls are successful, the price of DOT will rise and regain the previous highs of $34 and $38. However, if the current upward move meets rejection at the recent high, the altcoin will fall into the range bound zone. DOT fluctuates between the 21-day line SMA and the 50-day line SMA.
Polkadot indicator analysis
DOT price has broken the resistance line of the descending channel. The uptrend will continue if the price breaks the resistance line and closes above it. DOT is at the level 49 of the Relative Strength Index of the period 14, which indicates that there is a balance between supply and demand. The price of the cryptocurrency is above the 80% range of the daily stochastic. This indicates that the market has reached the overbought region. Sellers will show up in the oversold region of the market.

Technical indicators:
Major Resistance Levels - $48 and $52
Major Support Levels - $24 and $20
What is the next direction for Polkadot?
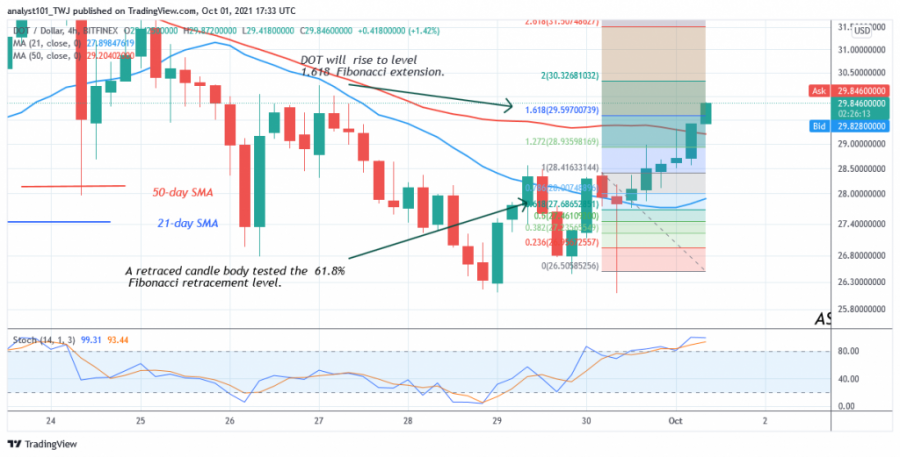
On the 4-hour chart, Polkadot has resumed its upward movement after the price rose above the moving averages. The current uptrend is reaching the overbought zone. Meanwhile, the September 30 uptrend has a candlestick testing the 61.8% Fibonacci retracement level. The retracement suggests that the price of DOT will rise to the 1.618 Fibonacci extension level or $29.59. From the price action, it appears that the market is retesting the 1.618 Fibonacci extension.

Disclaimer. This analysis and forecast are the personal opinions of the author and are not a recommendation to buy or sell cryptocurrency and should not be viewed as an endorsement by CoinIdol. Readers should do their research before investing funds.
News
Price
Price
News
Price

(0 comments)