Polkadot Rebounds above $36 Low, Attempts to Breach Resistance at $48

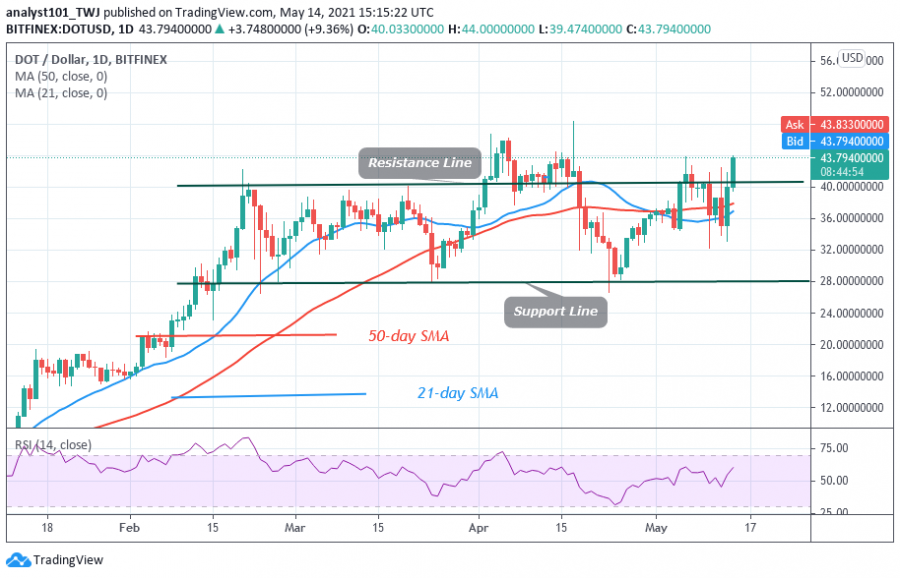
Polkadot price rebounds above $36 low as the bullish momentum breaks the resistance levels of $40 and $42. The altcoin price is attempting to break the $44 high. DOT/USD will attain a high of $48 if buyers break above the resistance at $44.
However, in the previous price action of April 5 and 17, DOT prices reached the highs of $45 and $48 and were repelled. The bulls failed to sustain the bullish momentum as a result of overwhelming selling pressure. Today, if Polkadot faces rejection at the recent high, the market will decline to the previous range-bound zone. Since February, the altcoin has been fluctuating between $28 and $40. Today, an uptrend is facing resistance at the recent high. The uptrend will resume if the bulls overcome the current resistance. Otherwise, the DOT price will fall into the range-bound zone.
Polkadot indicator analysis
The altcoin price is above the moving averages which suggest the possibility of Polkadot’s rise. DOT price has risen to level 62 of the Relative Strength Index period 14. It indicates that the market has reached the bullish trend zone and is capable of rising. The 21-day SMA and the 50-day SMA are sloping horizontally.

Technical indicators:
Major Resistance Levels – $48 and $52
Major Support Levels – $32 and $28
What is the next direction for Polkadot?
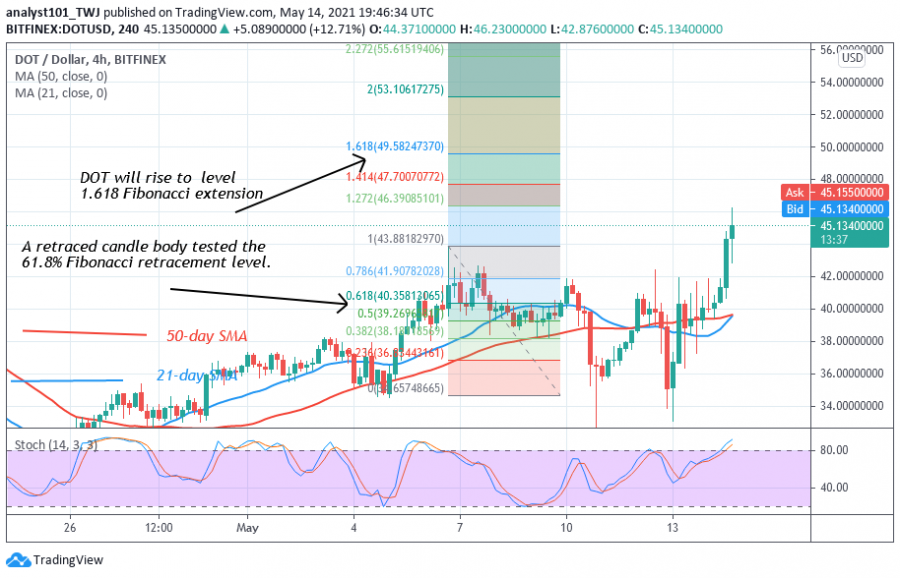
Polkadot has made an impressive bullish move on the upside. On May 6 uptrend; a retraced candle body tested the 61.8 % Fibonacci retracement. This retracement indicates that DOT will rise to level 1.618 Fibonacci extension or a high of $49.58. The Fibonacci tool will hold if the altcoin resumes an upward move.

Disclaimer. This analysis and forecast are the personal opinions of the author and are not a recommendation to buy or sell cryptocurrency and should not be viewed as an endorsement by CoinIdol. Readers should do their research before investing funds.
Price
Price
Price
News
Price

(0 comments)