Polkadot Breaks the Initial Resistance but Fails to Sustain Above $10 High
Updated: Aug 13, 2022 at 10:06

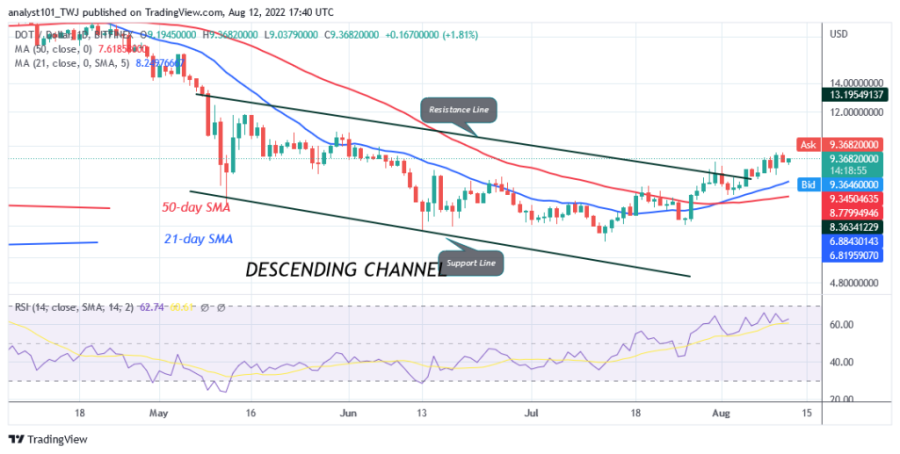
The price of Polkadot (DOT) is trading in the uptrend zone as it breaks above the moving average lines. The cryptocurrency has regained bullish momentum as it resumes its uptrend.
On August 5, the bulls broke through the resistance at $9.20 and reached the high of $9.64. The cryptocurrency is likely to continue rising as buyers try to push the altcoin to the highs of $10.79 and $11.84. However, further upward movement of the altcoin is unlikely as the market has reached the overbought zone. In the overbought area, sellers will emerge and push prices down. Nevertheless, if DOT/USD turns from the $10 high, the market will fall above the moving average lines or the $9.20 support.
Polkadot indicator analysis
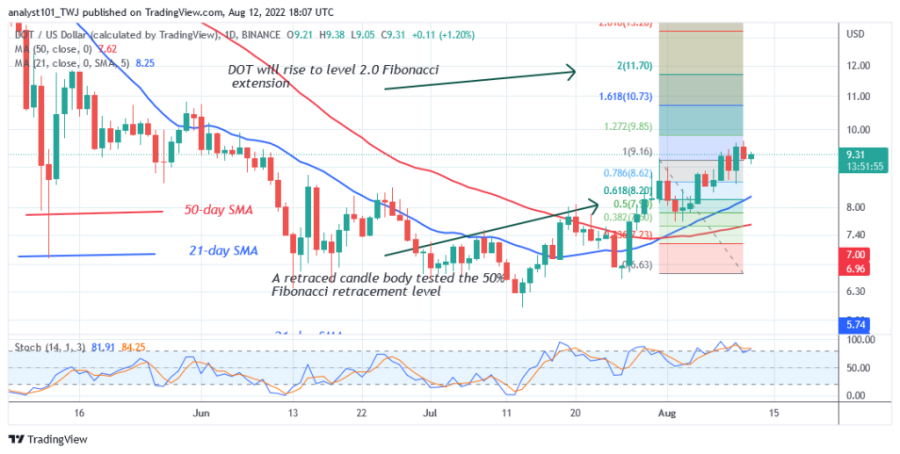
The cryptocurrency is at the 61 level of the Relative Strength Index for the 14 period. The price of DOT is in the uptrend zone and could continue to rise. The price of the altcoin is above the 21-day line SMA and the 50-day line SMA, which indicates that the price will continue to move upwards. DOT is above the 80% area of the daily stochastic. This suggests that the current uptrend has reached bullish exhaustion. There is a probability of a possible decline in the cryptocurrency.

Technical Indicators:
Key Resistance Zones: $10, $12, $14
Key Support Zones: $8.00, $6.00, $4.00
What is the next direction for Polkadot?
Polkadot has resumed its uptrend, but the market has reached the overbought region of the market. The altcoin is likely to decline or be forced to move sideways. However, the price indicator has shown a possible upward movement. In the July 31 uptrend, a candlestick tested the 50% Fibonacci retracement level. The retracement suggests that DOT will rise to the level of the 2.0 Fibonacci extension or to the level of $11.70.

Disclaimer. This analysis and forecast are the personal opinions of the author and are not a recommendation to buy or sell cryptocurrency and should not be viewed as an endorsement by CoinIdol. Readers should do their research before investing funds.
News
Price
Price
News
Price

(0 comments)