Litecoin Price: Bears Pose A Threat To Short Positions
Updated: Nov 22, 2023 at 12:18

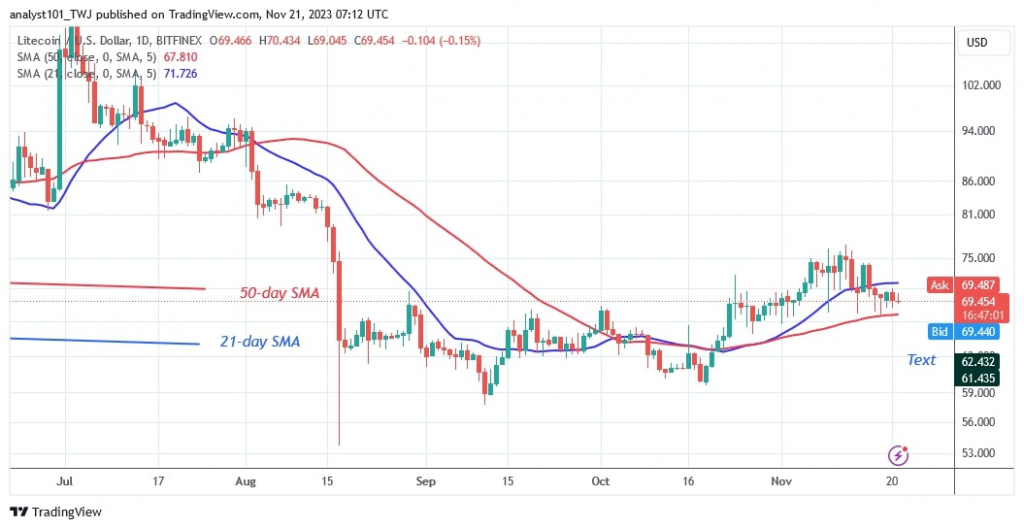
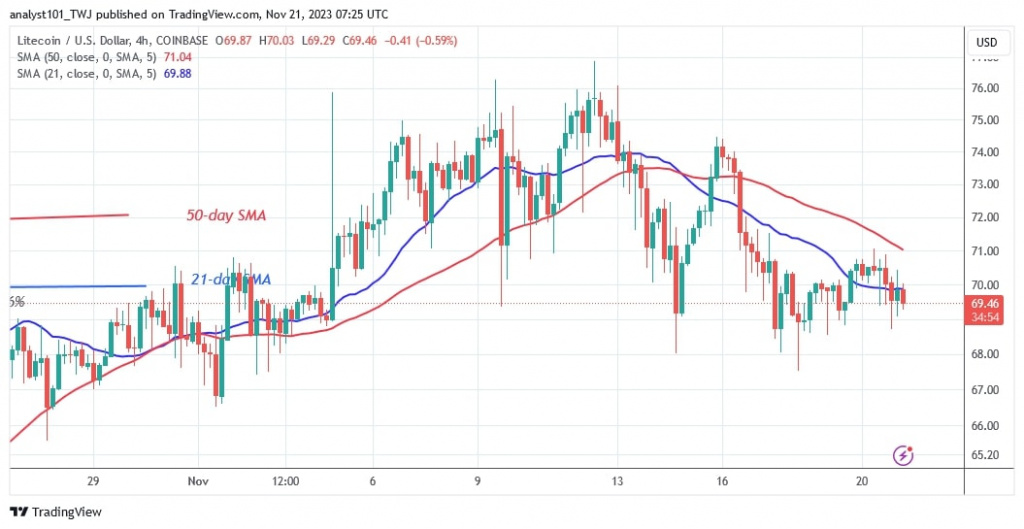
The price of Litecoin (LTC) has been declining since the end of the uptrend at $76. The altcoin fell below the 21-day SMA but remained above the 50-day SMA.
Litecoin price long-term forecast: bearish
Litecoin is trapped between the moving average lines. The price of the altcoin has fallen to the previous range between $60 and $70. If the bears break the 50-day SMA to the downside, the downward momentum is expected to continue. The price of the altcoin will fall further to around $60 or $54.
Meanwhile, the presence of doji candlesticks has limited the price movement. However, if the bearish scenario proves invalid, the trend is likely to continue within the trading range. If the moving average lines are broken, the altcoin will develop a trend. At the time of writing, Litecoin had reached a low of $67.6.
Analysis of the Litecoin indicators
The moving average lines are horizontally sloped and capture the price bars between them. This explains the cryptocurrency's potential range of fluctuation. Long candlestick tails indicate a breakout above the $60 support, where the price will come under significant buying pressure.
Technical indicators
Resistance levels: $100, $120
Support levels: $60, $40

What is the next move for Litecoin
Litecoin is currently moving sideways between the moving average lines. In other words, the price of Litecoin is moving between $60 and $70. This movement will continue for a few more days.
Previously Coinidol.com reported that Litecoin has been forced to move sideways since peaking at $76 on November 4.

Disclaimer. This analysis and forecast are the personal opinions of the author and are not a recommendation to buy or sell cryptocurrency and should not be viewed as an endorsement by CoinIdol.com. Readers should do their research before investing in funds.
Price
Price
Price
News
Price

(0 comments)