Litecoin Is in a Deadlock, Unable to Breach $200 High

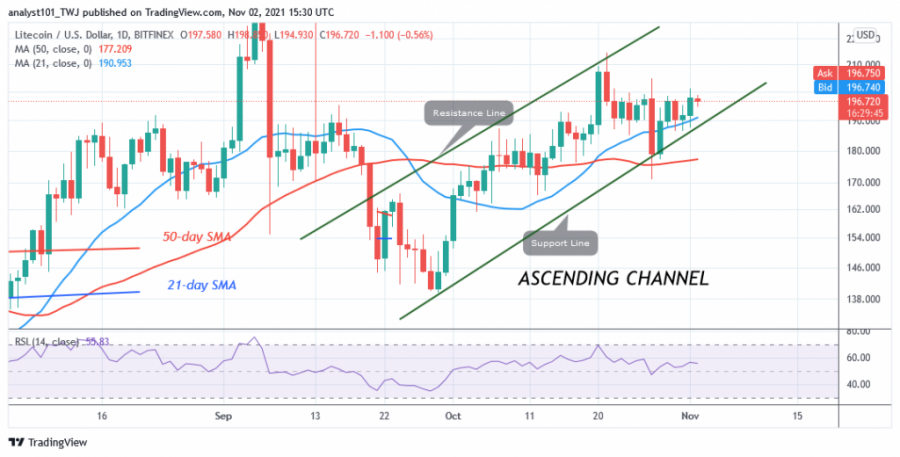
Litecoin (LTC) price is trading above the moving average but faces a rejection of the $200 high. Today, the LTC price has fallen to a low of $196.
Buyers have been desperately trying to break above the resistance level since October 21. On the breakout on October 20, buyers pushed the altcoin to the high of $210, but were rejected.
The LTC price dropped to $187 and corrected to the upside. The upward correction led to another decline on the downside. The market fell to a low of $171 as bulls bought the dips. If buyers break above resistance at $200 and $210 today, the market will rally to the earlier high of $230. In the meantime, XRP is faltering below the $200 resistance.
Litecoin indicator analysis
Litecoin has risen to the 55 level on the Relative Strength Index for period 14. LTC price is trading in the bullish trend zone and is above the centre line 50. Litecoin is above 60% of the daily stochastic. LTC/USD is in a bullish momentum.

Technical Indicators:
Resistance Levels: $200, $220, $240
Support Levels: $160, $140, $120
What is the next move for Litecoin?
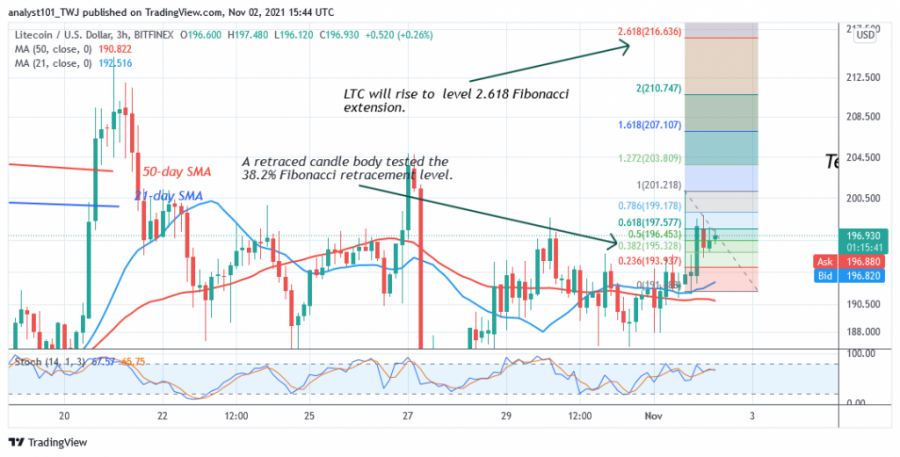
On the 4-hour chart, Litecoin is in an uptrend but faces resistance at the $200 high. Meanwhile, the uptrend from November 1 has retraced a candlestick that tested the 38.2% Fibonacci retracement level. The retracement suggests that LTC will rise to the 2.618 Fibonacci extension level, or $216.63.

Disclaimer. This analysis and forecast are the personal opinions of the author and are not a recommendation to buy or sell cryptocurrency and should not be viewed as an endorsement by CoinIdol. Readers should do their own research before investing funds.
Price
Price
Price
Price
Price

(0 comments)