Litecoin Rebounds above $120 Low, Targets High of $147.97
Updated: Jan 29, 2021 at 13:34

Litecoin’s bearish run reached a low of $120 yesterday. Promptly, the bulls ‘buy the dips' as the coin recovered from the recent low.
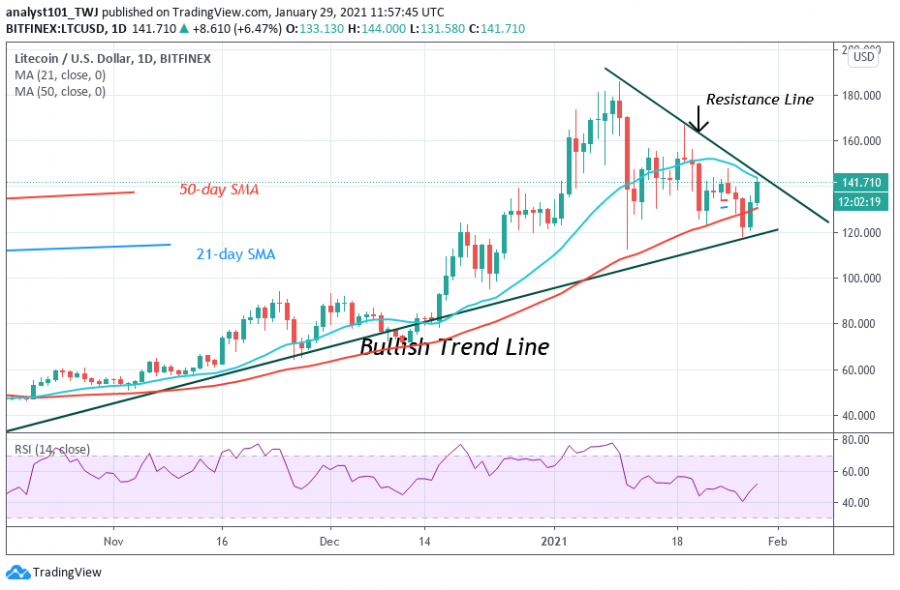
LTC has risen to $140 as it faces a minor resistance. The bottom line is that buyers must push LTC above the resistance line that was earlier formed. A resistance line was created from the peak price of $185 to the low of $140.
On the upside, if price breaks and closes above the resistance line, there could be a possible trend change. Litecoin will resume upside momentum. If the bulls break the initial resistance at $147, a retest at the $185 high is likely. Conversely, if the coin faces rejection at the recent high, the selling pressure is likely to continue. The bears will revisit the previous low at $120 to break below it. A breakdown will compel the coin to reach a low of $80.
Litecoin indicator analysis
On the daily chart, the crypto’s price has broken above the 50-day SMA. The price is approaching the 21-day SMA. A break above the SMAs will signal the rise of the coin. The price is close to breaking above the resistance line. The coin is at level 52 of the Relative Strength Index. It indicates that LTC is in the bullish trend zone.

Resistance Levels: $160, $180, $200
Support Levels: $100, $80, $60
What is the next move for Litecoin?
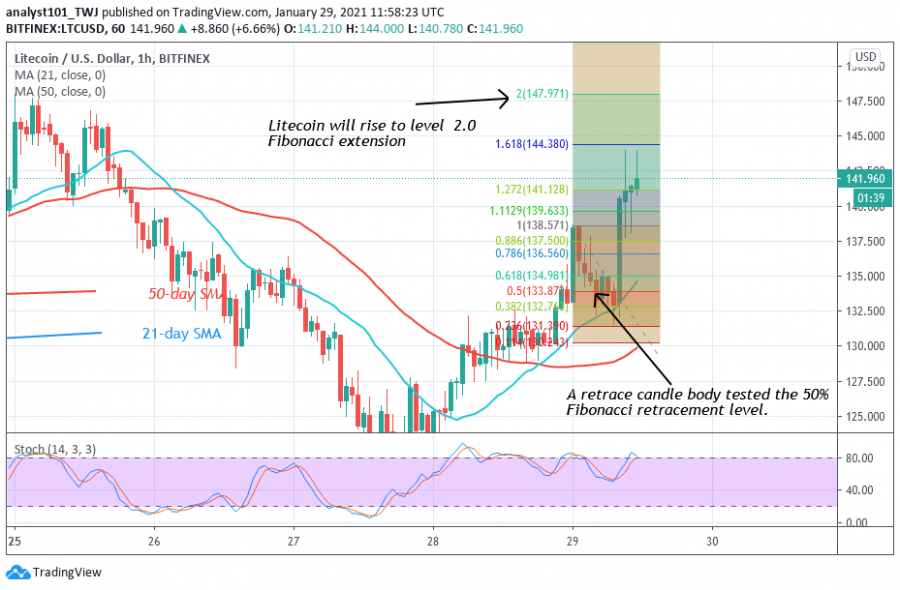
Litecoin has commenced an upward move. The Fibonacci tool has indicated a possible rise of the coin. On January 29 downtrend; a retraced candle body tested the 50% Fibonacci retracement level. This gives the impression that the coin will rise to level 2.0 Fibonacci extension level or a high of $147.97.

Disclaimer. This analysis and forecast are the personal opinions of the author that are not a recommendation to buy or sell cryptocurrency and should not be viewed as an endorsement by CoinIdol. Readers should do their own research before investing funds.
Price
News
Price
Price
Price

(0 comments)