Ethereum Swings Back And Forth, Retests The High At $1,300

The Ethereum price (ETH) is stuck between the moving average lines and consolidating above the support level of $1,200.
Ethereum Price Long Term Analysis: Bearish
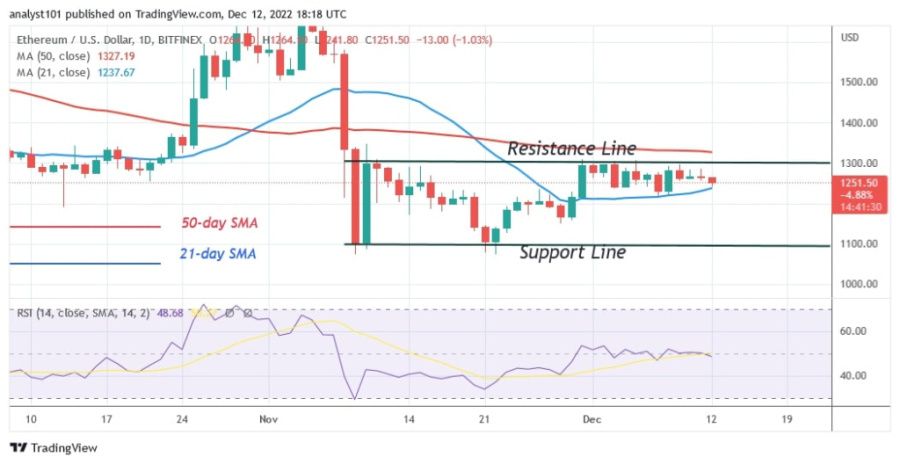
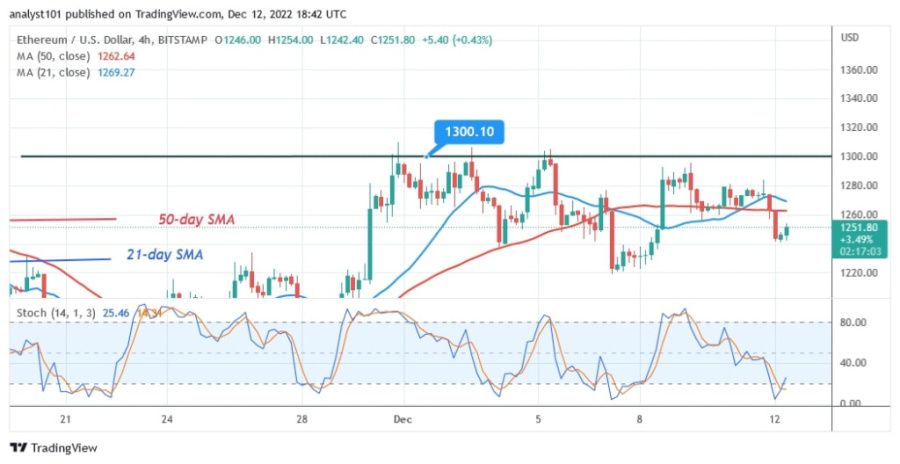
Since November 30, the Ether price has been hovering below the $1,300 level. Buyers have tried five times to keep the price above the $1,300 high but have been rejected each time. After each rejection, Ether bounces back and falls back above the $1,200 level.
As the bulls bought the dips today, Ether has fallen above the current support. The worst case scenario sees Ether falling below support at $1,100 if the bears break below current support. Buyers have been protecting current support since the price rallied on November 30.
Ethereum Indicator Analysis
For the 14 period, Ethereum is at the 49 level of the Relative Strength Index. Supply and demand are in balance. The price bars are between the moving average lines, which suggests that the price of Ether is likely to fluctuate within a limited range. The stochastic on the daily chart for Ether is at the 20 level or below. Bearish fatigue has been reached at the current downtrend.
Technical Indicators
Key resistance levels - $2,000 and $2,500
Key support levels - $1,500 and $1,000

What is the next direction for Ethereum?
Ethereum is fluctuating back and forth between the moving average lines. The market is still moving in the same direction. The resistance level of $1,300 has stopped the upward movement. Since it is trading in a limited price range, the price of Ether will either rise or fall.

Disclaimer. This analysis and forecast are the personal opinions of the author and are not a recommendation to buy or sell cryptocurrency and should not be viewed as an endorsement by CoinIdol. Readers should do their research before investing in funds.
News
News
Coin expert
News
Coin expert

(0 comments)