Ethereum Stabilizes Above $3,300, But Risks Descent
Updated: Jan 24, 2025 at 15:38

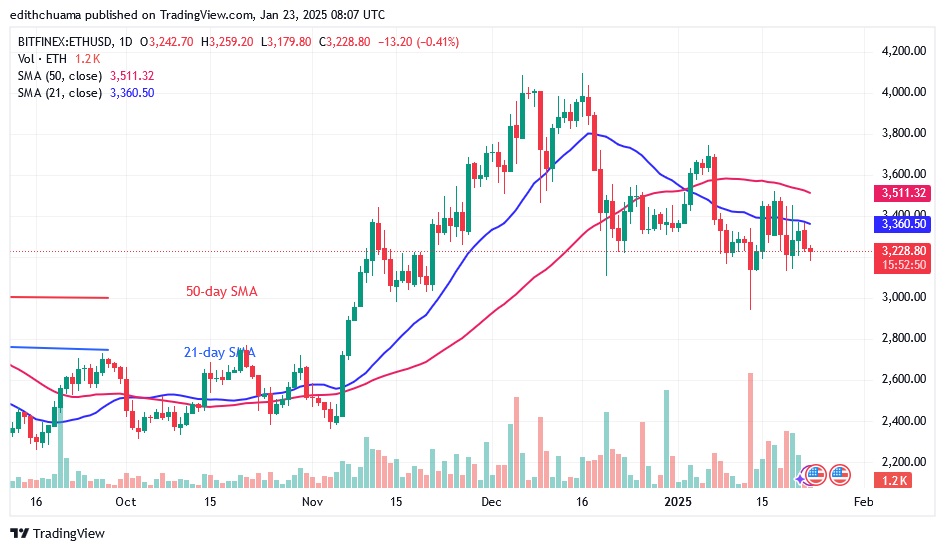
The price of Ethereum (ETH) has fallen below the moving average lines and reached a low of $3,228. The largest altcoin has been rejected twice from the 21-day SMA or resistance at $3,400.
Long-term analysis of the Ethereum price: fluctuation range
Ether is oscillating above the $3,000 support but below the $3,400 resistance level. Ether price is stagnating above the $3,300 support with doji candlesticks dominating the price action. If the price falls below the $3,300 support, Ether will retest its previous low of $2,941.
The largest altcoin will resume its uptrend if buyers keep the price above the moving average lines. Ether will test its recent highs of $3,744 and $4,094.
Ethereum indicator analysis
Ether prices are below the moving average lines after rejecting the high at $3,521. The long candle wicks at $3,521 indicate strong selling pressure at the recent high. The downtrend has held the moving average lines horizontally with a bearish crossover.

Technical indicators:
Key resistance levels – $4,000 and $4,500
Key support levels – $3,500 and $3,000
What is the next direction for Ethereum?
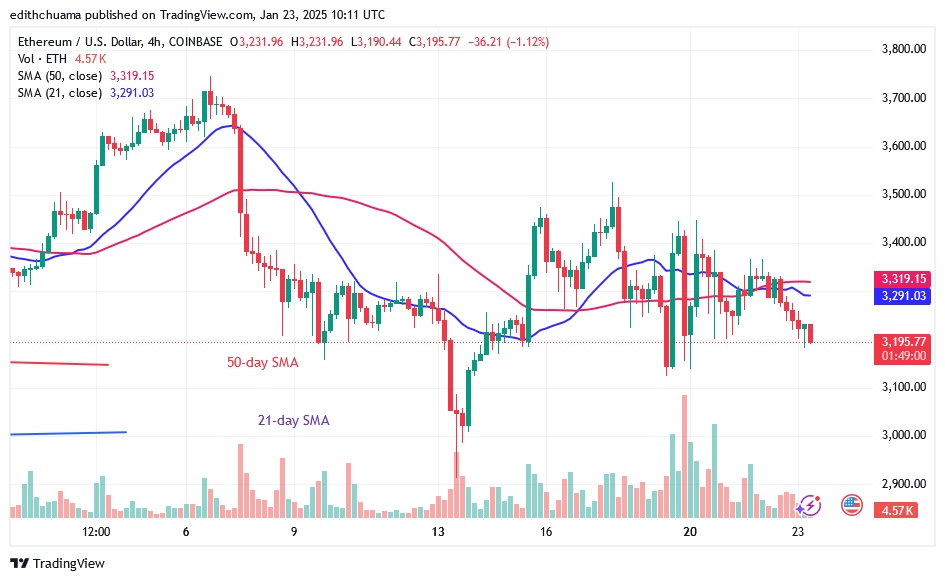
On the 4-hour chart, Ether price is stabilizing above the $3,300 support. The price action has remained consistent due to the development of a small uncertain candle called Doji. The candlesticks are signaling that traders are undecided about their next move.

Disclaimer. This analysis and forecast are the personal opinions of the author. They are not a recommendation to buy or sell cryptocurrency and should not be viewed as an endorsement by CoinIdol.com. Readers should do their research before investing in funds.
News
News
Coin expert

(0 comments)