Ethereum Continues Its Slide And Sets Its Sights On The $2,200 Mark
Updated: Jan 24, 2024 at 13:32

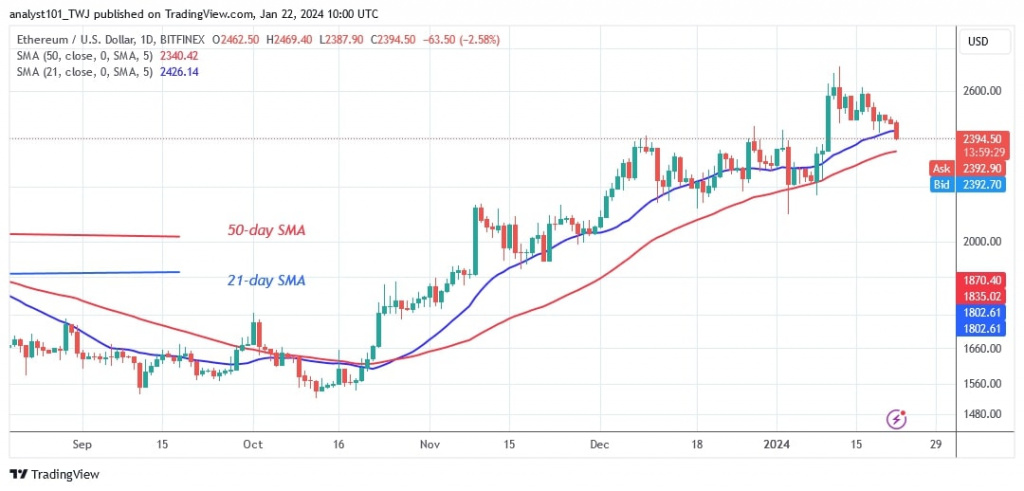
The price of Ethereum (ETH) has fallen below the 21-day SMA but is still above the 50-day SMA. Price analysis by Coinidol.com.
Long-term analysis of the Ethereum price: bearish
In other words, Ether has moved between the moving average lines. The altcoin has fallen to a low of $2,237 at the time of writing. The cryptocurrency is expected to fall above the 50-day SMA.
If the price falls below the moving average lines, the downside momentum will extend to the support above $2,200. The slide will be halted if the altcoin falls and finds support above the 50-day SMA. This will cause the cryptocurrency to oscillate between the moving average lines.
Analysis of the Ethereum indicator
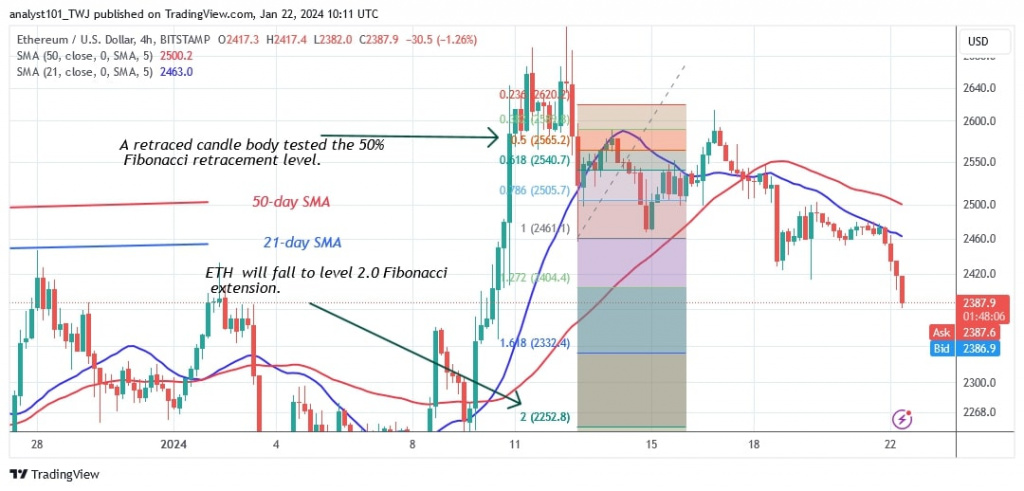
The largest altcoin has retreated between the moving average lines. This means that the cryptocurrency market is likely to experience a sideways movement. If the moving average lines are broken, the sideways trend will end. On the 4-hour chart, the price bars are below the downward moving average lines.
Technical indicators:
Key resistance levels – $2,200 and $2,400
Key support levels – $1,800 and $1,600

What is the next direction for Ethereum?
The 4-hour chart of Ethereum shows a negative swing. On January 12, the price of Ether rose and a candlestick body tested the 50% Fibonacci retracement level. This correction predicts that ETH will fall to the 2.0 level of the Fibonacci extension or $2,252.80. According to the price action, Ether has fallen to $2,377 as it approaches the target price.

Previously Coinidol.com reported that Ethereum has been in a sideways movement between $2,400 and $2,600 over the last week.
Disclaimer. This analysis and forecast are the personal opinions of the author and are not a recommendation to buy or sell cryptocurrency and should not be viewed as an endorsement by CoinIdol.com. Readers should do their research before investing in funds.
Price
News
News
Coin expert

(0 comments)