Ethereum Remains Unmoved And Holds Above The Support Of $1,800

Ethereum (ETH) is trading in a bearish trend zone.
Long-term analysis of Ethereum price: bearish
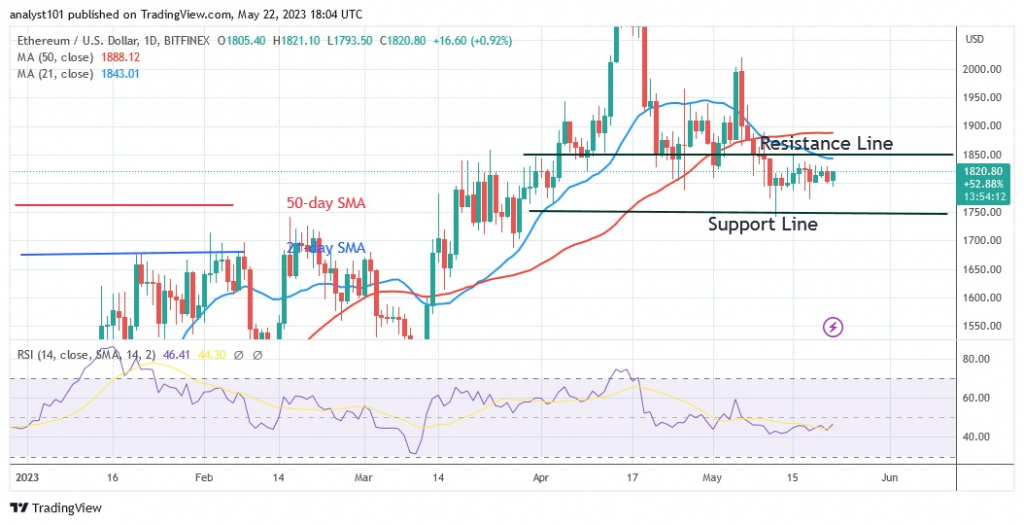
The downtrend of Ether has slowed down and it has been trading above the support level of $1,773 since May 11. On May 12, the largest altcoin started consolidating and rose above the support level of $1,770. Doji is a sequence of shapes of small, indecisive candlesticks. As Doji candlesticks dominate price action, price movement has remained immobile. At the time of writing, Ether is trading at $1,817.10. However, as the cryptocurrency rallies, it will perform. Ether will rally above the moving average lines or break the $1,900 level if the price rises above the $1,800 support level. Ethereum will reach its previous high of $2,000. However, the altcoin is currently holding above the support, and the bulls are holding on to it. The candle showed a sweeping long tail on May 12, indicating considerable price buying.
Ethereum indicator analysis
The largest altcoin is at level 45 on the Relative Strength Index for the period 14. The RSI is unchanged, and the altcoin is consolidating above the existing support. Ether is at risk of losing value if the price bars remain below the moving average lines. The daily stochastic for Ether is above the 50 level and shows a positive trend. The bullish momentum is currently decreasing.

Technical indicators:
Key resistance levels - $2,000 and $2,500
Key support levels - $1,800 and $1,300
What is the next direction for Ethereum?
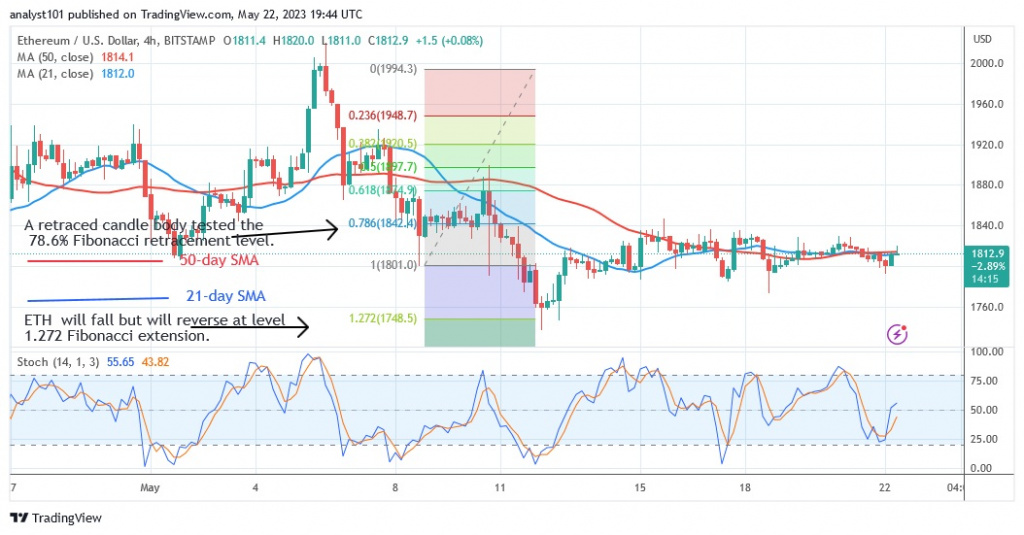
Ethereum's price action on May 12 is falling and reversing on the 4-hour chart. Ether completed an upward correction during the May 8 decline, and a candlestick tested the 78.6% Fibonacci retracement line. After the correction, ETH will decline, but will reverse at the 1.272 Fibonacci extension level or the $1,748.50 level.

Disclaimer. This analysis and forecast are the personal opinions of the author and are not a recommendation to buy or sell cryptocurrency and should not be viewed as an endorsement by CoinIdol. Readers should do their research before investing in funds.
News
Price
Price
Price
Price

(0 comments)