Ethereum Falls Back, But Remains Solidly Above $2,400
Updated: May 21, 2025 at 19:05

Ethereum has been moving sideways since the upswing was halted on May 13. Cryptocurrency price analysis brought by Coinidol.com.
Long-term analysis of the Ethereum price: bullish
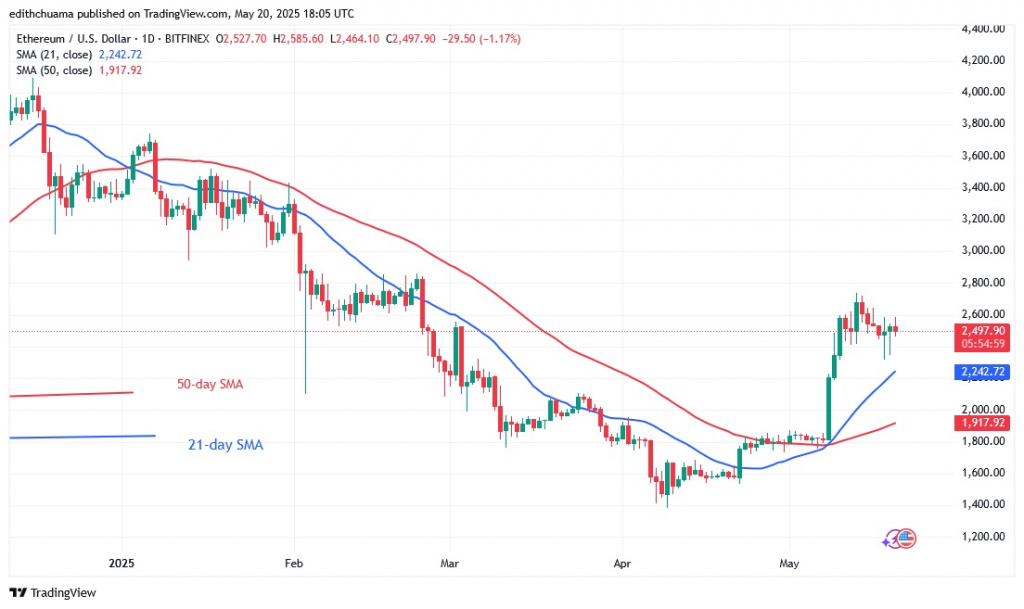
The largest altcoin failed to break above the $2,800 mark but reached a high of $2,737. It then fell and started to move sideways below the barrier at $2,800 and above the support at $2,400. The bears have repeatedly tested the current support at $2,400 and if it loses it, it will fall above the 21-day SMA support or the low at $2,200. Ethereum is trading above $2,502 and is likely to continue its uptrend if the $2,400 support holds. The altcoin will rise and retest the $2,800 level. Ethereum will initiate an uptrend if the $2,800 barrier or the $2,400 support is broken.
Ethereum indicator analysis
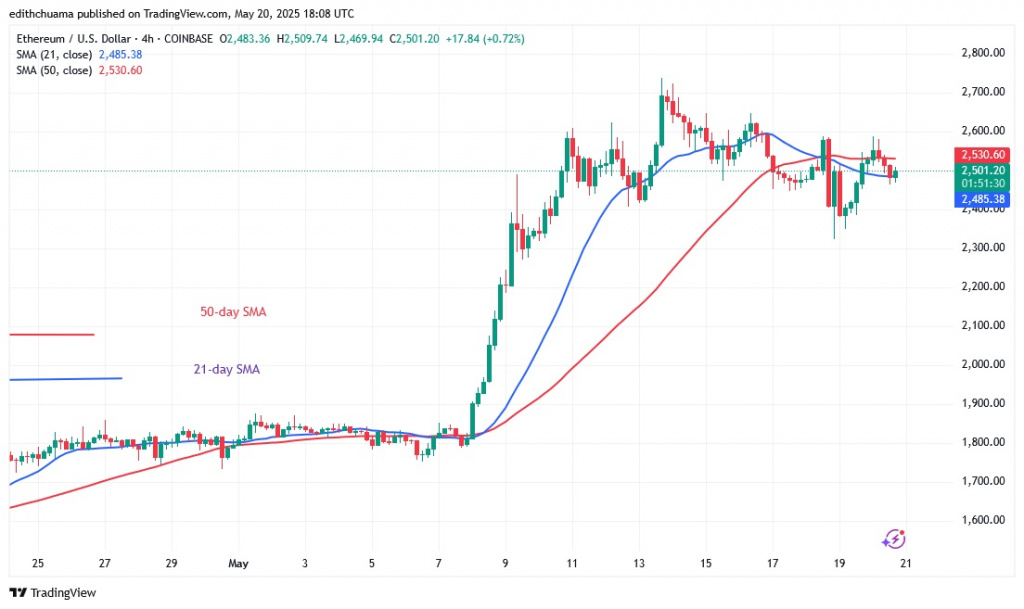
On May 18 and 19, long candle tails show above the $2,400 support. This indicates strong buying pressure above the $2,400 support level. Ethereum price bars have retraced and held above the 21-day SMA. This indicates that the value of cryptocurrencies will continue to rise. The sideways trend is indicated by the horizontal moving average lines on the 4-hour chart.

Technical indicators:
Key resistance levels – $4,000 and $4,500
Key support levels – $2,000 and $1,500
What is the next direction for Ethereum?
Ethereum has retraced and remained above the moving average lines. The largest altcoin is expected to continue its uptrend as it remains above the 21-day SMA support. On the 4-hour chart, Ether is moving sideways, above the $2,400 support and below the $2,700 resistance. Once these levels are broken, the altcoin will start a new trend.

Disclaimer. This analysis and forecast are the personal opinions of the author. They are not a recommendation to buy or sell cryptocurrency and should not be viewed as an endorsement by CoinIdol.com. Readers should do their research before investing in funds.
News
News
Coin expert

(0 comments)