Ethereum Remains Consistent as It Attempts to Breach the $1,280 High
Updated: Jul 15, 2022 at 11:31

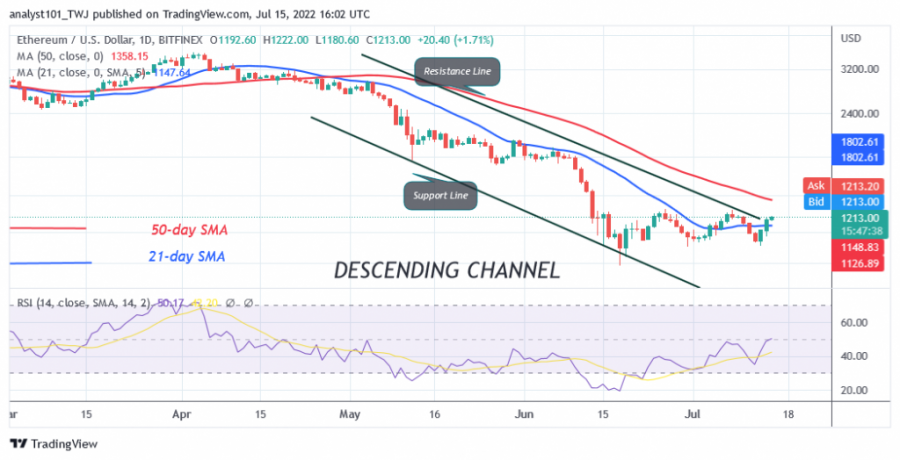
The price of Ethereum (ETH) is in a downward correction after breaking above the 21-day line SMA. The upward movement is likely to fail at the $1,280 level. This is the third time that Ether will face resistance at the $1,280 level.
Yesterday, the largest altcoin broke out above the 21-day line SMA when it met resistance at $1,280. A break above resistance at $1,280 will send the altcoin rising above the 50-day line SMA. The bullish momentum will also extend to the high of $2,013. If Ether falls at the high of $1,280, the bears will try to push the altcoin below the moving average lines. The moving average lines are now positioned as resistance levels. Meanwhile, ETH/USD is trading at $1,216.40 at the time of writing.
Ethereum indicator analysis
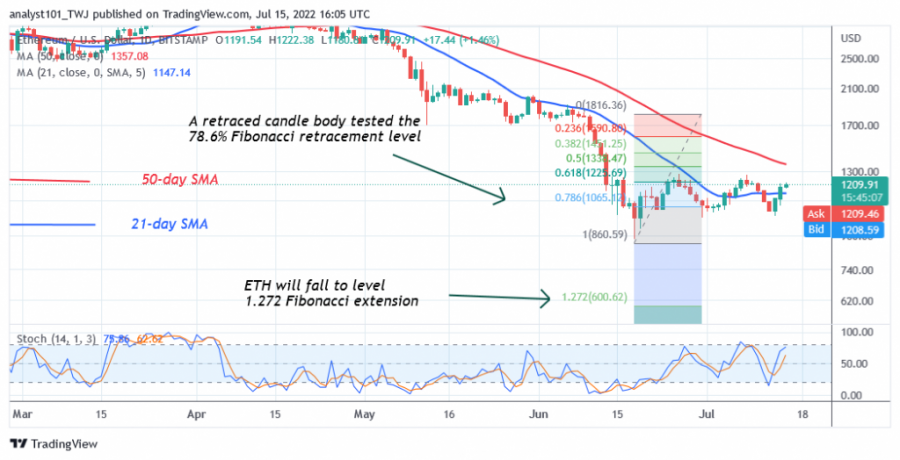
Ether is at level 49 of the Relative Strength Index for period 14, indicating that there is a balance between supply and demand. The price bar of the cryptocurrency is above the 21-day line SMA, but below the 50-day line SMA, indicating a possible movement within a trading range. In this case, the altcoin will enter a trend when the range boundaries are broken. The daily stochastic is above the 75% range. The cryptocurrency is in a bullish momentum. The current uptrend is likely to be short-lived.

Technical indicators:
Major Resistance Levels - $2,000 and $2,500
Major Support Levels - $1,000 and $500
What is the next direction for Ethereum?
Ether downtrend has eased as the market resumes its upward correction. The largest altcoin is vulnerable to a decline when the price falls below the moving average lines. Meanwhile, on May 12 downtrend, a retraced candle body tested the 78.6% Fibonacci retracement level. The retracement suggests that Ether will fall, but reverse at the level of 1,272 Fibonacci extension or the level of $600.

Disclaimer. This analysis and forecast are the personal opinions of the author and are not a recommendation to buy or sell cryptocurrency and should not be viewed as an endorsement by CoinIdol. Readers should do their research before investing funds.
News
News
Coin expert

(0 comments)