Ethereum Recovers, But Only Up To The $3,000 Mark
Updated: Jan 21, 2025 at 15:54

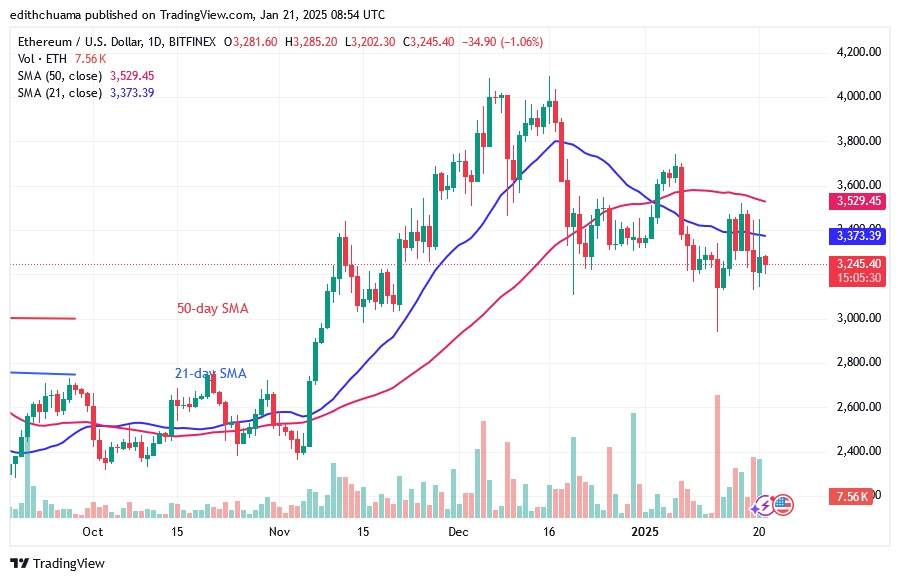
The latest price analysis by Coinidol.com report, the price of Ethereum (ETH) has been moving in a range above the $3,000 support but below the 50-day SMA or resistance at $3,600.
Long-term analysis of the Ethereum price: fluctuation range
On January 13, the negative trend broke through the crucial support and hit a low of $2,941, but the bulls bought the dips. Selling pressure has eased and Ether is trading above the $3,100 support but below the moving average lines.
Today, Ether is rallying but being rejected by the moving averages. A break above the moving averages will herald the restart of the uptrend. Ether will rally but will have to overcome the first obstacle at $3,700. Today, Ether has reached a high of $3,376, at the time of writing. The negative trend will start if Ether falls below the $3,100 support. The market will continue to move sideways.
Ethereum indicator analysis
Ether prices are below the moving average lines, but selling pressure has paused above support at $3,100. The sideways trend has held the moving average lines horizontally. Long candlesticks point to the $3,000 support, indicating significant buying demand at a lower price.

Technical indicators:
Key resistance levels – $4,000 and $4,500
Key support levels – $3,500 and $3,000
What is the next direction for Ethereum?
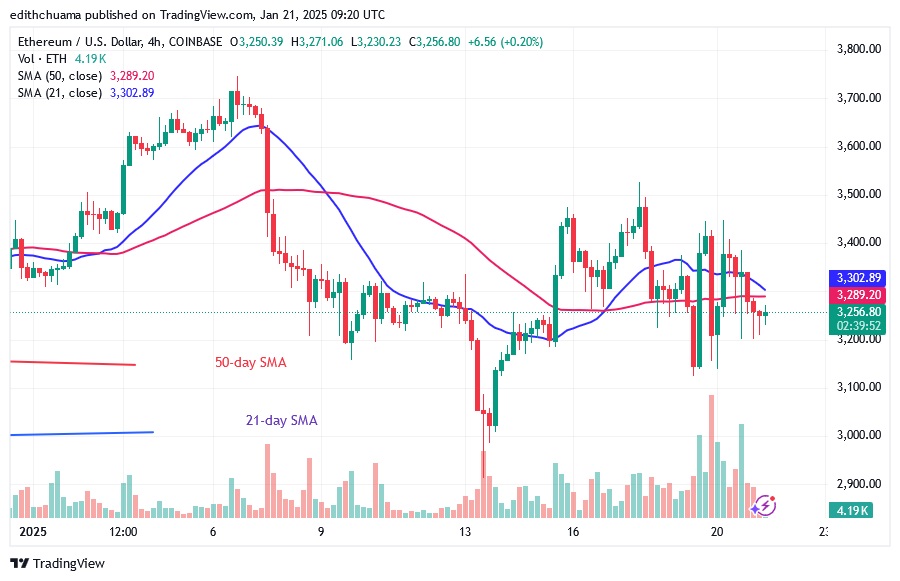
On the 4-hour chart, Ether is moving within a narrow range. The moving average is keeping the uptrend in check. The price of the cryptocurrency is fluctuating between below and above the moving average lines, with extended candle wicks and tails. The wicks show strong selling pressure at the recent high. The extended candlestick tail indicates significant buying pressure at the lower price point.

Disclaimer. This analysis and forecast are the personal opinions of the author. They are not a recommendation to buy or sell cryptocurrency and should not be viewed as an endorsement by CoinIdol.com. Readers should do their research before investing in funds.
News
News
Coin expert

(0 comments)