Ethereum Rallies above $1,763 Low but Struggles below $1,900 High

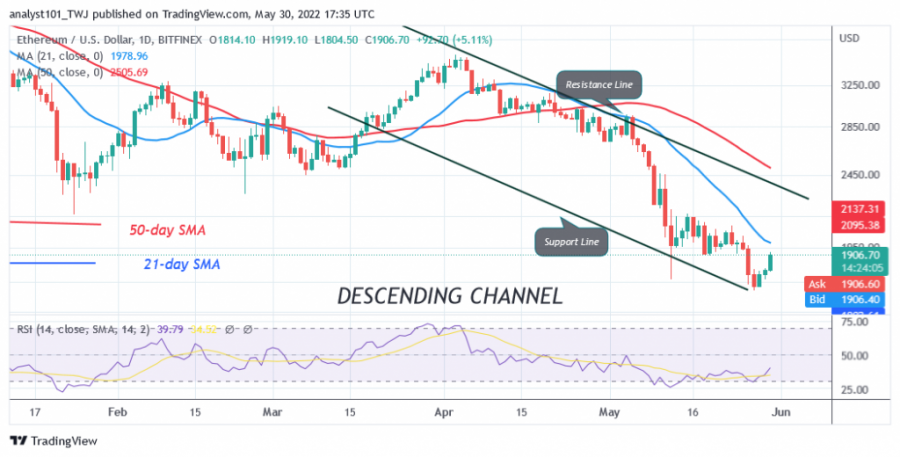
Ethereum price (ETH) is returning to its previous low and recovering from the support at $1,763. The largest altcoin has broken out above the high at $1,900 and is reaching the previous range zone.
Long-term analysis of the Ethereum price: fluctuation range
In the previous price action, the bulls failed to overcome the $2,200 resistance zone. Now they have the difficult task of overcoming the 21-day line SMA, which is the next resistance.
If the bulls overcome the $2,200 resistance, ether will rally above the 50-day line SMA. The upward momentum will continue if the bullish momentum is maintained above the moving averages. Conversely, the downward correction will continue if Ether breaks out of the $2,200 resistance zone and moves higher. The largest altcoin will fluctuate between the price levels of $1,900 and $2,200. In the meantime, the cryptocurrency has continued its upward trend.
Analysis of the Ethereum indicator
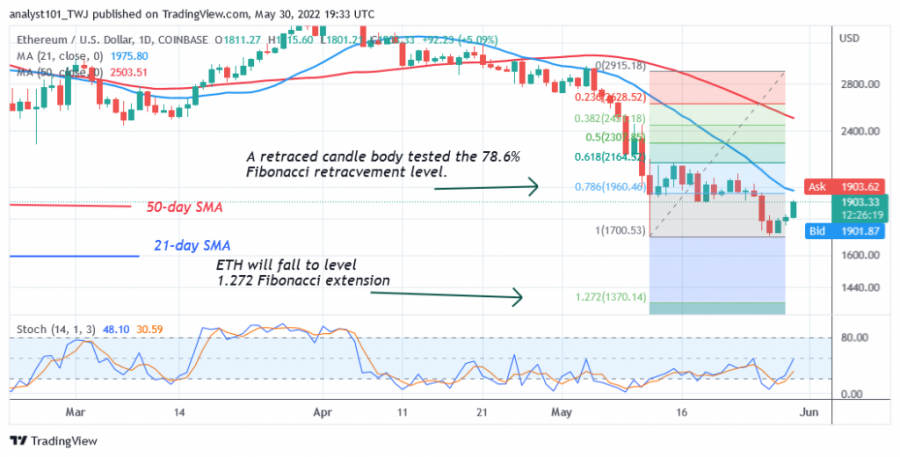
ETH is at level 39 of the Relative Strength Index for the period 14. The cryptocurrency is still in a downward trend, although it is moving positively. Ether price bars are below the moving averages, which makes it vulnerable to a decline. It is above the 40% area of the daily stochastics. The altcoin has resumed its bullish momentum. The 21-day line and the 50-day line SMAs are sloping downward, indicating a downtrend.

Technical Indicators:
Key resistance levels - $3,500 and $4,000
Key support levels - $2,500 and $2,000
What is the next direction for Ethereum?
Ether is in an upward correction and testing the previous low. It is approaching the 21-day moving average line, which acts as a resistance line. The altcoin will fall when it encounters resistance at the recent high. Meanwhile, on May 12 downtrend; a retraced candle body tested the 78.6% Fibonacci retracement level. The retracement suggests that ETH will fall to the 1,272 Fibonacci Extension level or $1,370.14.

Disclaimer. This analysis and forecast are the personal opinions of the author and are not a recommendation to buy or sell cryptocurrency and should not be viewed as an endorsement by CoinIdol. Readers should do their research before investing funds.
Price
Price
Price
Price
Price

(0 comments)