Ethereum Price Slides And Pauses Above $3,200 Support
Updated: Jul 28, 2024 at 11:42

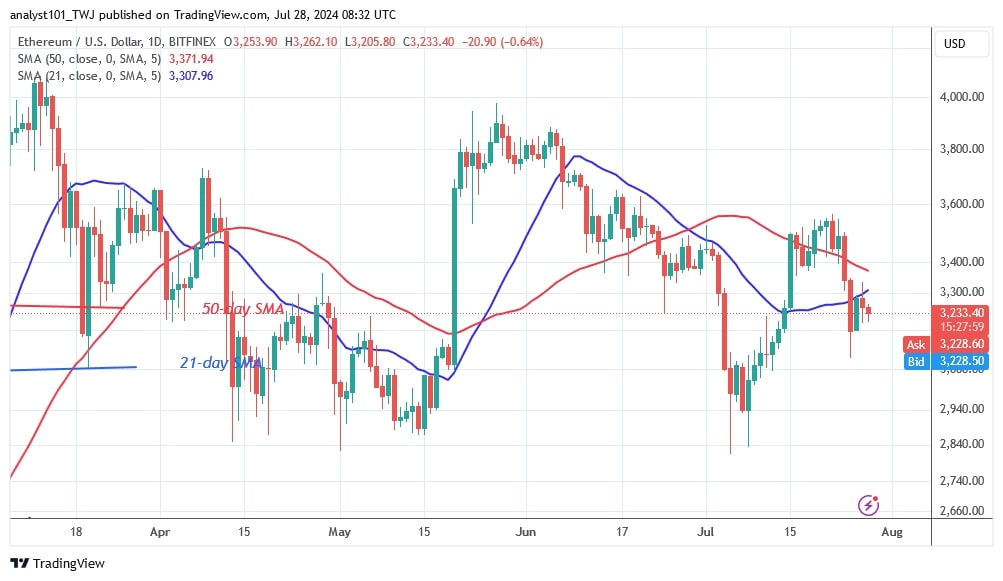
The price of Ethereum (ETH) fell below the moving average lines on July 25. The largest altcoin reached the $3,600 resistance zone and was decisively rejected.
Long-term analysis of the Ethereum price: bearish
After the breakout on July 15 and 19, buyers tried to hold the price above the $3,600 high but failed. On July 25, Ether fell to a low of $3,093 and the bulls bought the dips. For the past four days, the altcoin has been trading above the $3,000 support level but below the 21-day SMA resistance.
Today, the currency is falling after hitting the 21-day SMA resistance. Selling pressure has started after the rejection of the 21-day SMA. Should the bears break the $3,000 support, the market would fall to its previous low of $2,850. At the time of writing, the altcoin is valued at $3,240.
Analysis of the Ethereum indicators
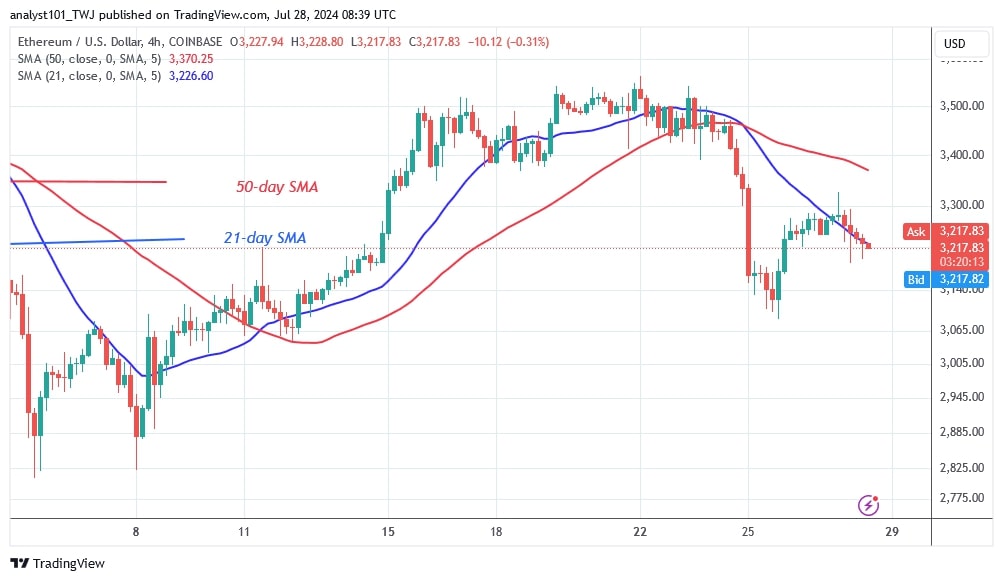
After the price drop on July 25, as reported by Coinidol.com, Ether bears returned to the negative trend zone. The decline was confirmed when the price of the cryptocurrency retested the 21-day SMA resistance. On both charts, the moving average lines show a bearish crossover, indicating a current downtrend.
Technical Indicators:
Major Resistance Levels – $4,000 and $4,500
Major Support Levels – $3.500 and $3,000

What is the next direction for Ethereum?
On the 4-hour chart, Ethereum is bearish and trading in a narrow range of $3,065 to $3,300. During the upward correction, the bulls were beaten back from the 21-day SMA or resistance at $3,300. The altcoin has paused in its price range caused by the formation of doji candles. The doji candles are keeping the altcoin stable above the $3,200 support.

Disclaimer. This analysis and forecast are the personal opinions of the author and are not a recommendation to buy or sell cryptocurrency and should not be viewed as an endorsement by CoinIdol.com. Readers should do their research before investing in funds.
News
News
Coin expert

(0 comments)