Ethereum Price is Ranging Between Supply and Demand Zones

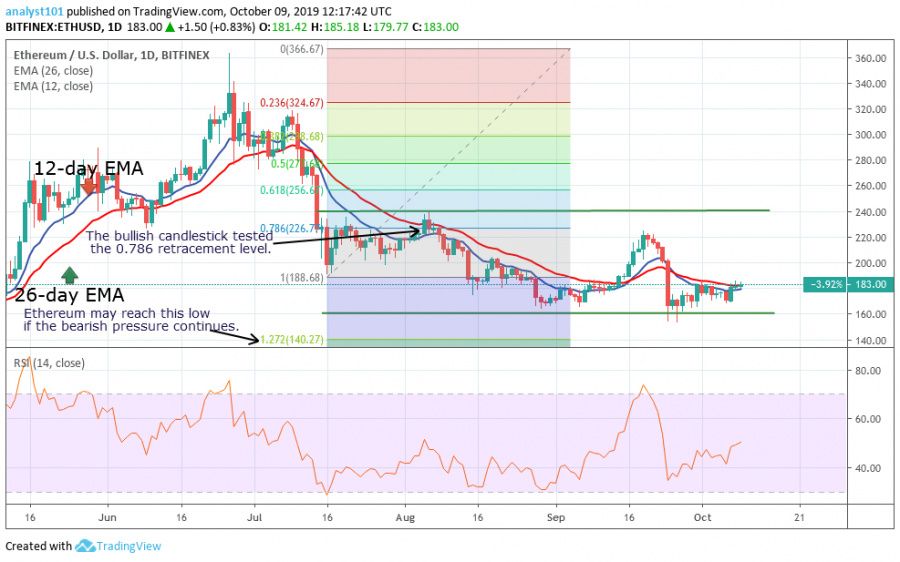
October 9, the ETH/USD pair is trading between the $160 demand zone and the $240 supply zone. There appears to be equality and indecision between buyers and sellers.
The price seems to fluctuate within the said zones because the bearish pressure is beginning to dry up. Also, the price upward move is hampered because of lack of buyers at the upper price zones. For instance, in the last 48 hours, the price is struggling to break the $185 price zone.
On the upside, if the price overcomes the initial hurdle at the $185 price zone, the coin will rise and test the $240 supply zone. Conversely, if the price fails to break the $185 price zone, the market will fall and resume its range-bound move toward the $160 demand zone. The demand zone has been holding as at today. Ethereum may rise if more buyers come in at the demand zone. However, the failure of more buyers at the demand zone will compel sellers to break the $160 demand zone.
Ethereum Indicator Reading
The Relative Strength Index period 14 level 49 has indicated that the market is in a range-bound movement. On the daily chart, there are two horizontal trend lines. The price has failed to break the upper trend line on two occasions. On the other hand, the market has reached a bearish exhaustion as it fails to breach the lower trend line on three occasions.

From the Fibonacci tool, a bullish candlestick body tested the 0.786 Fibonacci retracement level as indicated by the arrow. This correction at the retracement level indicates that the market may likely fall to the low of 1.272 Fibonacci extension level. However, from the price action, Ethereum has been trading above the 1.272 Fibonacci extension level in October.
What Is the Next Direction for Ethereum?
The coin will continue its range bound movement if the upper and lower trend line remains intact. Ethereum will continue to struggle above the lower trend line as more buyers are in short supply. In other words, the price will continue to trade below the 12-day and 26-day EMA exponential moving averages. A break above the exponential moving averages will indicate a rise in the price of Ethereum.
Disclaimer. This analysis and forecast are the personal opinions of the author are not a recommendation to buy or sell cryptocurrency and should not be viewed as an endorsement by CoinIdol. Readers should do their own research before investing funds.
Price
News
Price
Price
Price

(0 comments)