Ethereum Price Oscillates And Prepares For A Future Rebound

The Ethereum price (ETH) has oscillated between moving average lines, although it remains above the $1,800 support level. Cryptocurrency price analysis on Coinidol.com
Long-term analysis of the Ethereum price: bearish
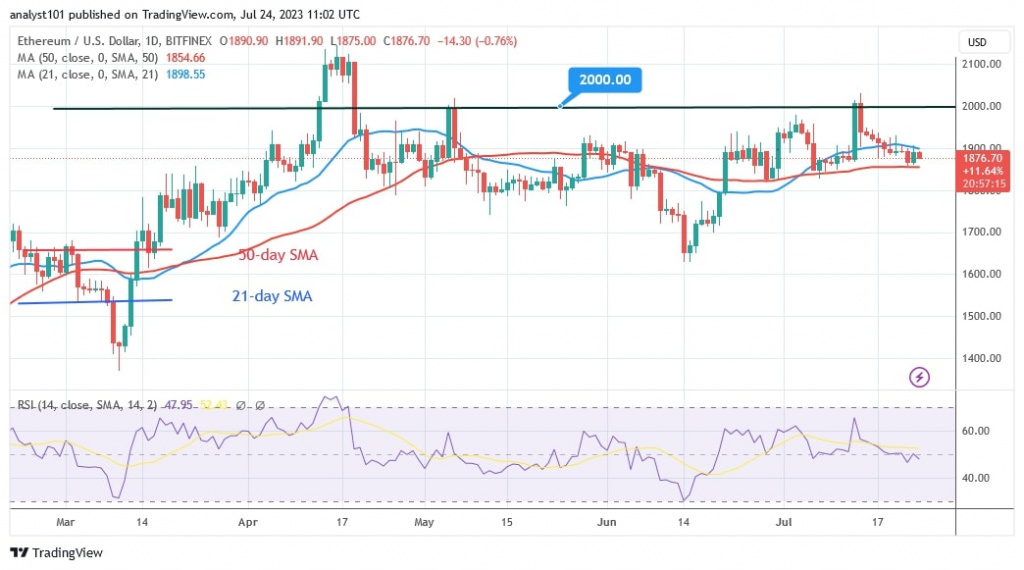
The recent price slide has reached bearish fatigue above the $1,800 support level. Since June 28, Ether has held its current support as it prepares for a future recovery. The largest altcoin is currently trading at $1,873.50. Ether has been trapped between the moving average lines since July 18.
The price indicator suggests that selling pressure has reached bearish exhaustion. However, if the bears manage to fall below the 50-day line SMA, the downtrend would resume. The 21-day line SMA and the barrier at $1,900 have halted the upward movement. If the resistance levels are broken, the altcoin will resume its uptrend. The market will rise to the previous high of $2,000.
Ethereum Indicator Analysis
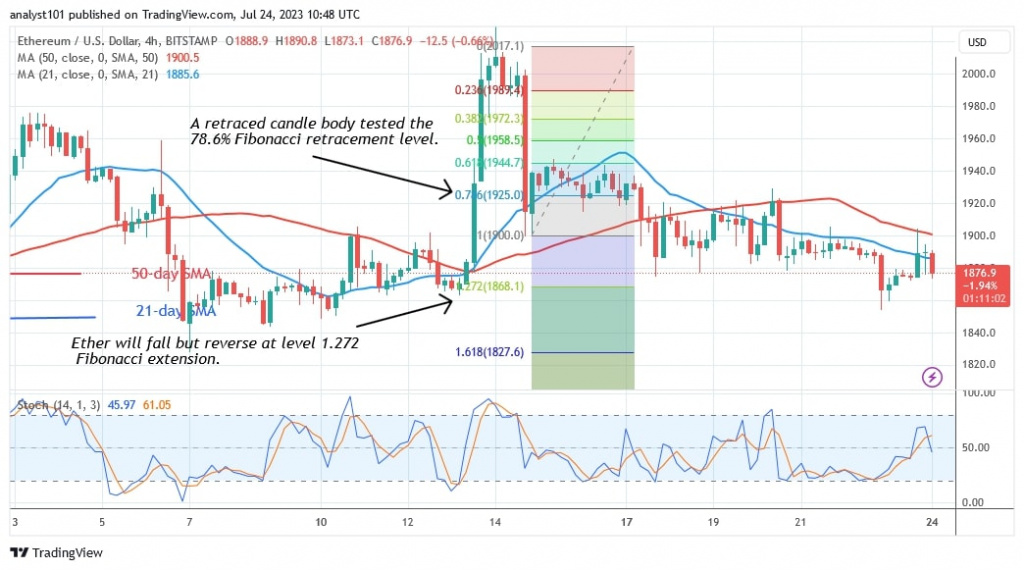
Analysis of Ethereum price oscillated between the moving average lines last week as the altcoin maintains its rangebound trend. Ether entered the bearish trend zone and faces another decline. The relative strength index is in the 14 range at 47. The downward momentum has stalled below the daily stochastic level of 50.
Technical Indicators:
Key resistance levels - $1,800 and $2,000
Key support levels - $1,600 and $1,400

What is the next direction for Ethereum?
The price of ETH/USD is moving in a range between the moving average lines or between $1,800 and $1,900. The market will continue to move in this range for a few more days as Ether approaches the current support level of $1,800 or the 50-day line SMA.
Last week Coinidol.com reported that Ethereum (ETH) has declined and stabilized above the $1,800 support due to the presence of doji candlestick, and was trading on the market in a price range between the moving average lines.

Disclaimer. This analysis and forecast are the personal opinions of the author and are not a recommendation to buy or sell cryptocurrency and should not be viewed as an endorsement by CoinIdol.com. Readers should do their research before investing in funds.
Price
News
News
Coin expert

(0 comments)