Ethereum Holds Above $1,400 As Negative Momentum Wanes

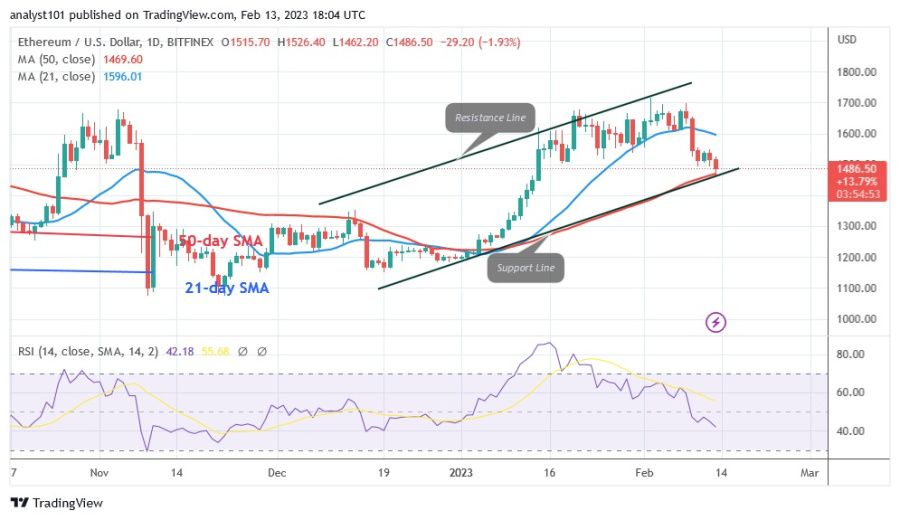
The Ethereum price (ETH) is falling and approaching a low of $1,462.20.
Long-term analysis of the Ethereum price: bearish
As Ether holds its position above the 50-day line SMA, the negative momentum has subsided. By the way, the biggest altcoin is locked inside the moving average lines. If Ethereum stays above the current support, it will be forced to move in a range for a few days. However, if the current levels are broken, the altcoin will develop a trend. On the downside, the market will fall to a low of $1,352 if the bears break below the 50-day line SMA. The selling pressure will eventually fall to $1,200. If the Ether price rises above the 21-day line SMA, the positive momentum will resume. The altcoin will return to its high at $1,700.
Ethereum indicator analysis
The relative strength index for Ether has decreased to the value of 44 for the period 14. The altcoin is in a downtrend and could fall further. As long as the price bars remain between the moving average lines, the largest altcoin could continue its movement within the range. Below the 25 mark of the daily stochastic, the altcoin experiences bearish momentum.

Technical indicators:
Key resistance levels - $2,000 and $2,500
Key support levels - $1,800 and $1,300
What is the next direction for Ethereum?
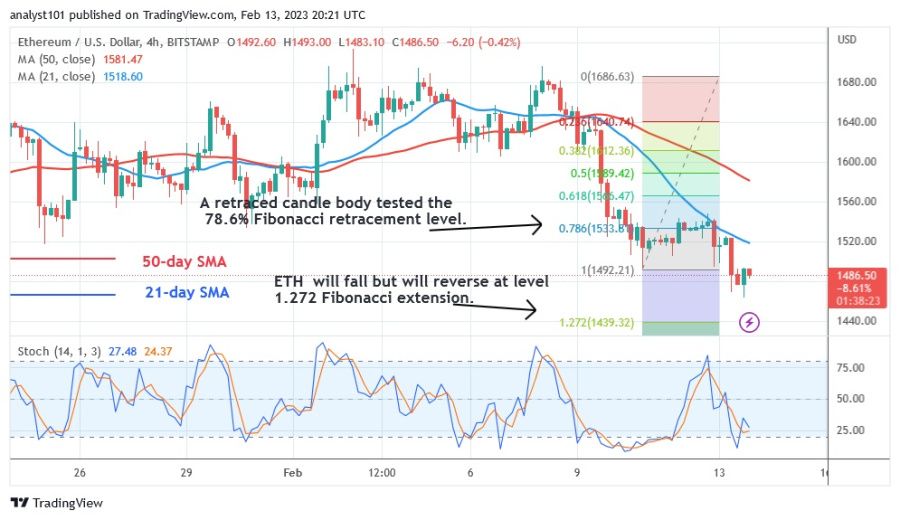
Ether is experiencing bearish momentum as it holds above the $1,400 support. Bearish fatigue has been reached with selling pressure. During the downtrend on February 10, Ether experienced an upside correction and a candlestick tested the 78.6% Fibonacci retracement line. The correction suggests that ETH will decline, but will turn around at the Fibonacci extension of 1.272 or $1,439.32.

Disclaimer. This analysis and forecast are the personal opinions of the author and are not a recommendation to buy or sell cryptocurrency and should not be viewed as an endorsement by CoinIdol. Readers should do their research before investing in funds.
Price
Price
News
Price
Price

(0 comments)