Ethereum Faces Resistance at $150 and $160 Zones May Attract More Selling

Ethereum is declining and may drop to a new low at $136. Ethereum will rise to a high of $175 if the bulls jump over the resistance zones.
Ethereum Price Long-Term Analysis: Bullish
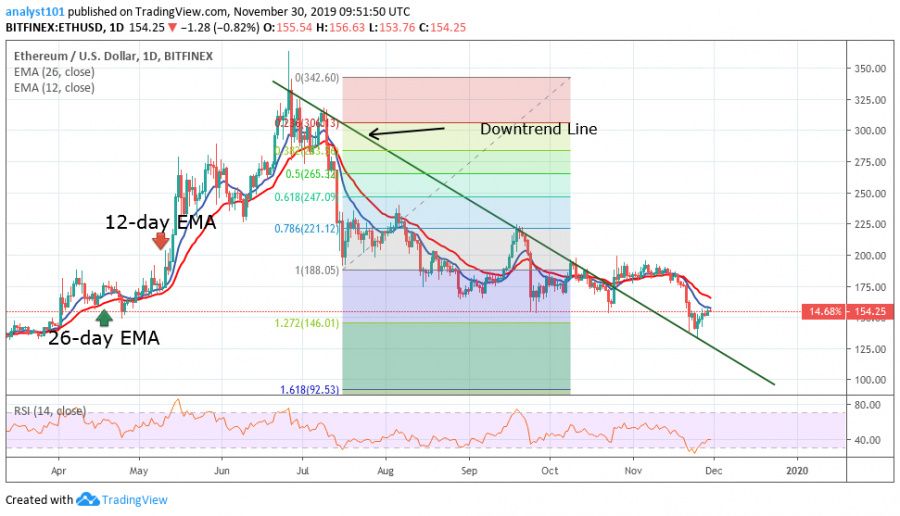
After its sudden fall to a low of $136, the pair moves up and got stuck at $150 and $160 supply zones. Today, Ethereum is gradually declining from the price at $158. The bulls made concerted efforts to push the price above the $150 and $160 but were repelled. The price at $150 and $160 has proven to be strong resistance.
Therefore, if the market continues to decline, ETH will suffer more depreciation. The pair is declining to the new low of $136. There are indications that the pair will fall to a new low of $120. Nonetheless, if the support holds, the bulls will revisit the previous high.
Ethereum Indicator Analysis
The present bullish movement was as a result of price falling to the support of the trend line. The reverse would have been the situation if the price has fallen below the trend line. The blue line EMA is acting as a resistance to the coin that is declining.

Key Supply Zones: $220, $240, $260
Key Demand zones: $160, $140, $120
What Is the Next Direction for Ethereum?
At present, the pair is declining as buyers fail to penetrate the prices at $150 and $160. We are expecting Ethereum to shoot up and breach the zone if the declining market puts a hold to its downward move. Traders should refrain from the initiation of any trade but watch if the coin falls to the new low of $136. Thereafter, you can lookout for a buy stop.
Disclaimer. This analysis and forecast are the personal opinions of the author are not a recommendation to buy or sell cryptocurrency and should not be viewed as an endorsement by CoinIdol. Readers should do their own research before investing funds.
Price
Price
News
Price
Price

(0 comments)