Ethereum Experiences A Slump And Fears A Crash To $3,575

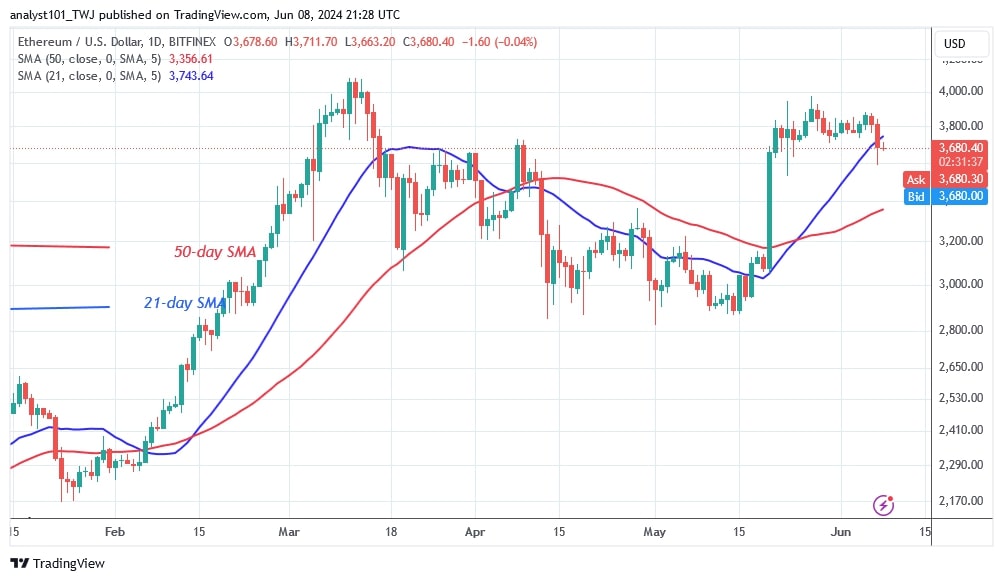
The price of Ethereum (ETH) could remain under selling pressure if the bears break the 21-day moving average line or support at $3,700.
Long-term analysis of the Ethereum price: bullish
On the upside, the bullish scenario has become invalid. Buyers have failed to break through the resistance levels above the high of $3,900. The altcoin fell to a low of $3,584 before recovering.
On the downside, the bears have broken the 21-day SMA support, which means the altcoin would drop to a floor above the 50-day SMA or the $3,360 support. In the meantime, Ether has fallen between the moving average lines. At the time of writing, the value of the altcoin stands at $3,679.
Ethereum indicator analysis
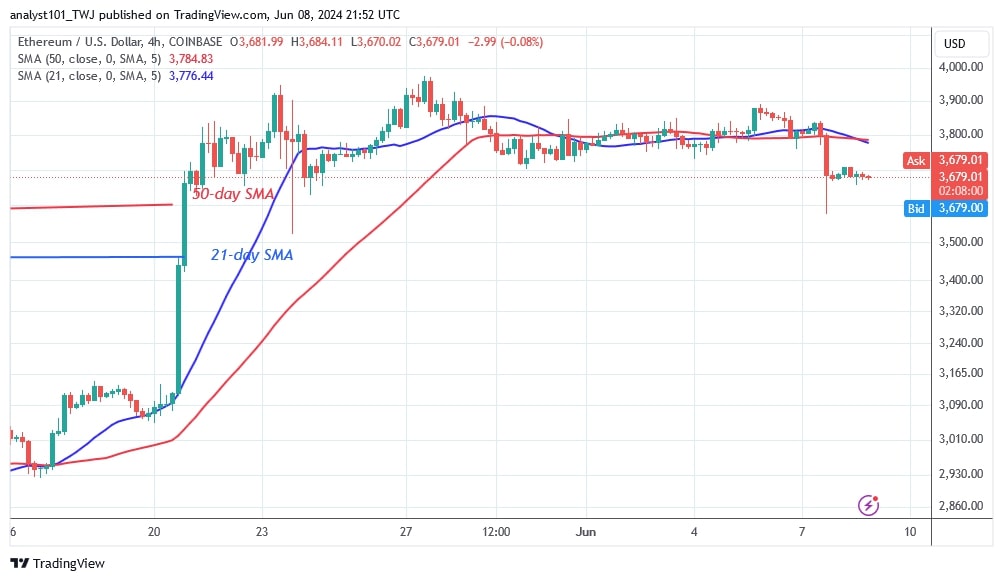
After the recent dip, Ether is currently trading below the 21-day SMA but above the 50-day SMA support. Ether is expected to fall if it loses its 21-day SMA support. The presence of doji candlesticks has caused a slight decline. On the 4-hour chart, the 21-day SMA has crossed below the 50-day SMA, which is a bearish signal.
Technical indicators:
Key resistance levels – $4,000 and $4,500
Key support levels – $3,500 and $3,000

What is the next direction for Ethereum?
Ethereum has fallen below the moving average lines on the 4-hour chart. On June 7, Ether experienced a breakdown and the altcoin fell to a low of $3,575, but the bulls bought the dips. The bulls halted the slide above the $3,685 support. Ether is consolidating above the $3,685 support. If the current support is broken, selling pressure could continue.

Disclaimer. This analysis and forecast are the personal opinions of the author and are not a recommendation to buy or sell cryptocurrency and should not be viewed as an endorsement by CoinIdol.com. Readers should do their research before investing in funds.
Price
Price
Price
Price
News

(0 comments)