Ethereum Slumps And Could Return To Its $3,000 Low
Updated: Dec 24, 2024 at 16:41

The latest price analysis by Coinidol.com report, the price of Ethereum (ETH) has slipped below its moving average lines.
Long-term analysis of the Ethereum price: bearish
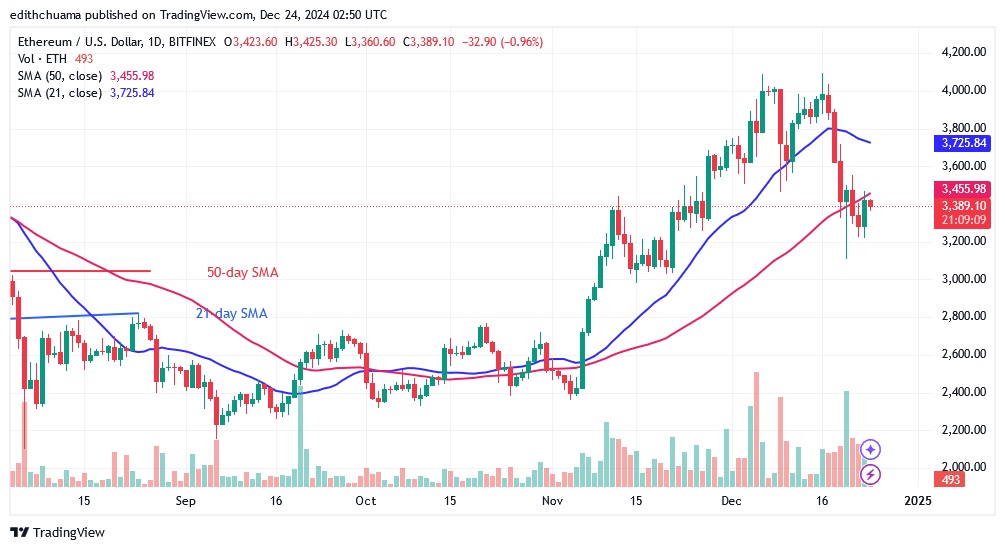
The price of Ethereum (ETH) has slipped below its moving average lines. Buyers tried to hold the price above the 50-day SMA but were unsuccessful for the second time. The largest altcoin is currently trading below the 50-day SMA support. This is beneficial for the sellers as it will drive the price to the $3,000 support level. On December 23, the positive trend reversed and the altcoin came under selling pressure. On the downside, buyers are expected to hold the $3,000 support. If the current support at $3,000 holds, Ether will be forced to trade between $3,000 and $4,094. If buyers push the price above the 21-day SMA, the uptrend will resume. Ether will rise to its previous high of $4,094. At the time of writing, the Ether price stands at $3,393.
Ethereum indicator analysis
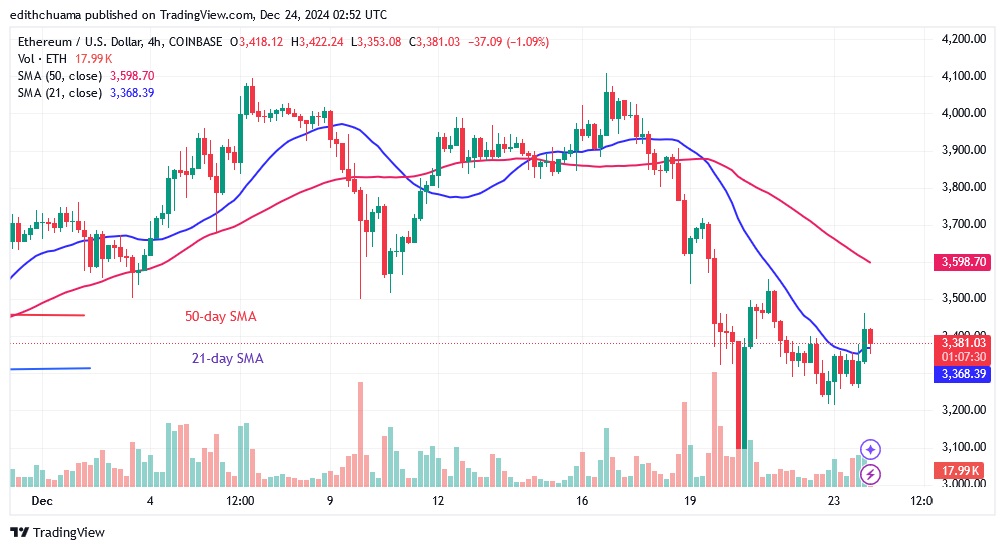
After the recent decline, the price of the cryptocurrency is now below the moving average lines. On the 4-hour chart, the price bars are between the moving average lines. This indicates that the price of the cryptocurrency is likely to move within a certain range. On December 20, a long candlestick tail points to the $3,000 support. This indicates that the $3,000 support is under significant pressure.

Technical indicators:
Key resistance levels – $4,000 and $4,500
Key support levels – $3,500 and $3,000
What is the next direction for Ethereum?
Ether's slide came to an abrupt halt on December 20, but then reversed. The downtrend was halted by the 21-day SMA. The price of the cryptocurrency is currently above the 21-day SMA but below the 50-day SMA on the 4-hour chart. Ethereum is expected to trade between the $3,000 support and the moving average lines.

Disclaimer. This analysis and forecast are the personal opinions of the author. They are not a recommendation to buy or sell cryptocurrency and should not be viewed as an endorsement by CoinIdol.com. Readers should do their research before investing in funds.
News
News
Coin expert

(0 comments)