Ethereum Slumps to $1,750 Low, Unable to Sustain Above $2,000 High
Updated: Feb 22, 2021 at 13:41

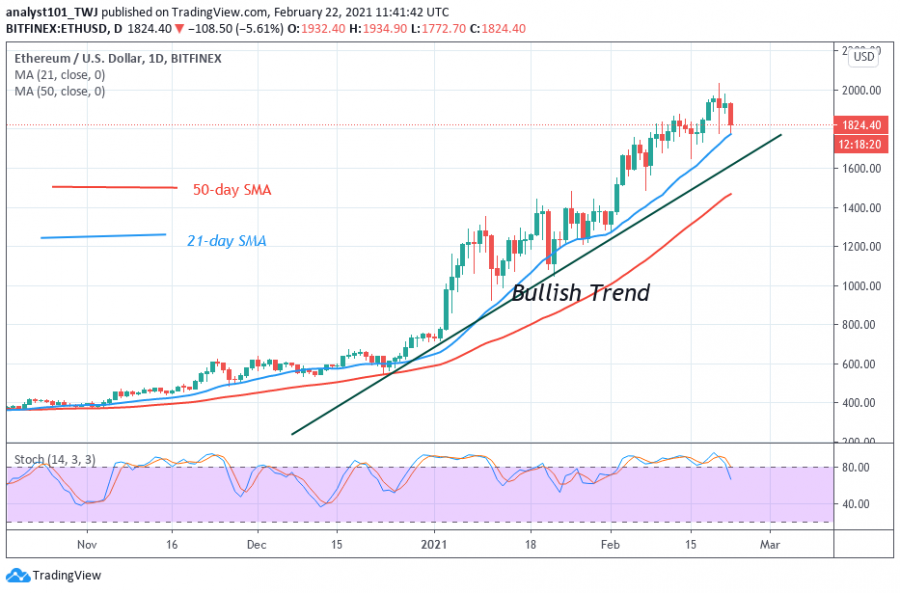
Ethereum (Ether, ETH) declines after buyers fail to convincingly break the $2,000 overhead resistance. The bulls broke the overhead resistance twice but could not sustain the bullish momentum.
Ethereum Price Long-Term Analysis: Bullish
In the first breakdown, Ether plunged to a low of $1,780. The bulls promptly bought the dips as the biggest altcoin rallied to a $1,975 high. Unfortunately, the upward move was restricted at that level.
After three unsuccessful attempts at the minor resistance, the selling pressure resumed. Ether fell to the previous low at $1,775. After the recent fall, the candlesticks are showing long tails. The candlesticks with long tails indicate there is strong buying pressure at a lower price level. Ether fell to $1,775 support and pulled back. The market may resume upward if the current support holds. Otherwise, the downtrend will resume.
Ethereum Indicator Analysis
Ether's price has fallen to the support above the 21-day SMA. The uptrend will resume if the 21-day SMA holds. Alternatively, if price breaks below the SMAs, the selling pressure will resume. The altcoin is below the 80% range of the daily stochastic. This indicates that the market has bearish momentum.

Technical indicators:
Major Resistance Levels – $2,500 and $2,700
Major Support Levels – $1.800 and $1,600
What Is the Next Direction for Ethereum?
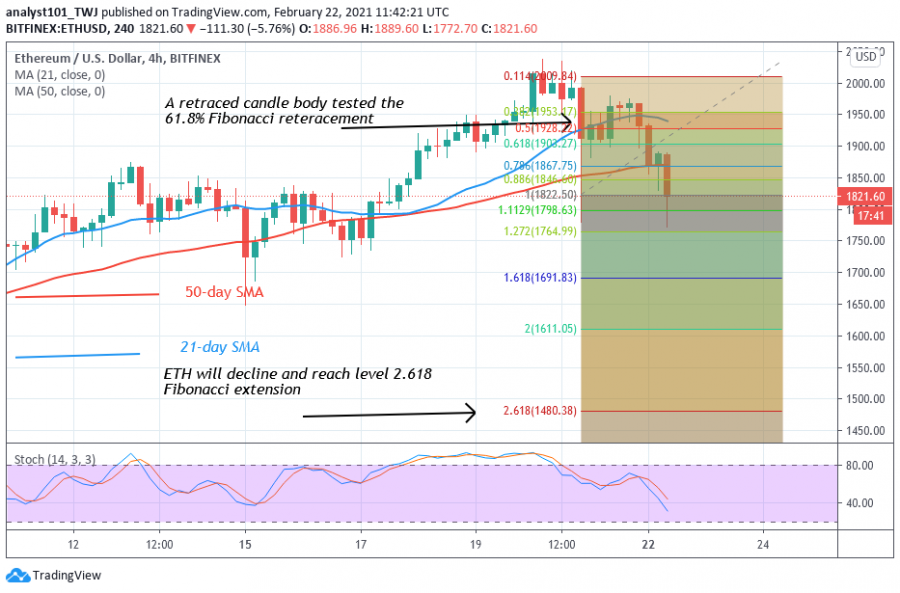
Ethereum is in a downward move after rejection at the $2,000 high. On February 20 uptrend; a retraced candle body tested the 38.2 % Fibonacci retracement level. This retracement indicates that ETH will fall to level 2.618 Fibonacci extensions or a low of $1,480.38.

Disclaimer. This analysis and forecast are the personal opinions of the author and not a recommendation to buy or sell cryptocurrency and should not be viewed as an endorsement by CoinIdol. Readers should do their research before investing funds.
News
Coin expert
Politics
Price
Price

(0 comments)