Ethereum’s Price Uptrend Faces The $2,100 Barrier
Updated: Mar 26, 2025 at 19:45

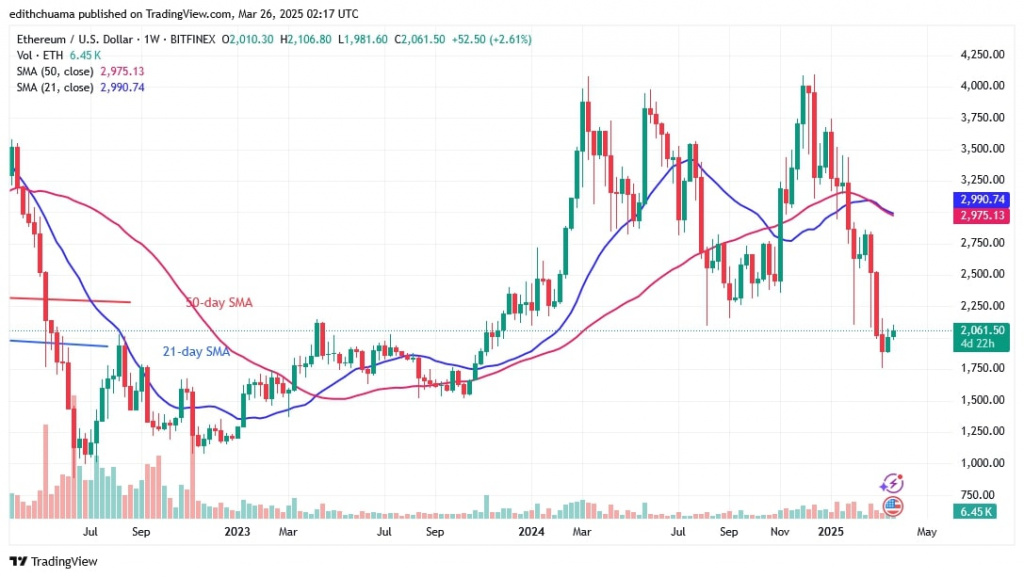
ETH price broke above the 21-day SMA after bouncing off the support at $1,900.
Ethereum price long-term analysis: bearish
The largest altcoin is below the 50-day SMA barrier but above the 21-day SMA support. ETH is pulling back south as resistance at $2,100 hinders the upside. Ether will rise if the bulls break above the psychological price threshold of $2,000.
On the other hand, ETH will fall back to its previous low of $1,754 if it declines further and falls below the 21-day SMA support. Ether is currently trading above the 21-day SMA support at $2,055.
Ethereum indicator analysis
The moving average lines have dropped significantly on the daily chart. ETH will be forced to move above support as the price bars are above the 21-day SMA but below the 50-day SMA. The long candlestick tails on the weekly chart are pointing below the $2,000 support, indicating strong buying pressure.
Technical Indicators:
Key Resistance Levels – $4,000 and $4,500
Key Support Levels – $2.000 and $1,500

What is the next direction for Ethereum?
At a high of $2,100, the bullish momentum hits its first obstacle. However, Ether will have to make a range-bound move between the $1,750 support and below the most recent high of $2,100 if it is unable to break above the initial barrier.

Disclaimer. This analysis and forecast are the personal opinions of the author. They are not a recommendation to buy or sell cryptocurrency and should not be viewed as an endorsement by CoinIdol.com. Readers should do their research before investing in funds.
News
News
Coin expert

(0 comments)