Ethereum Falls Above $2,300 As Bearish Sentiment Emerges
Updated: Nov 05, 2024 at 15:15

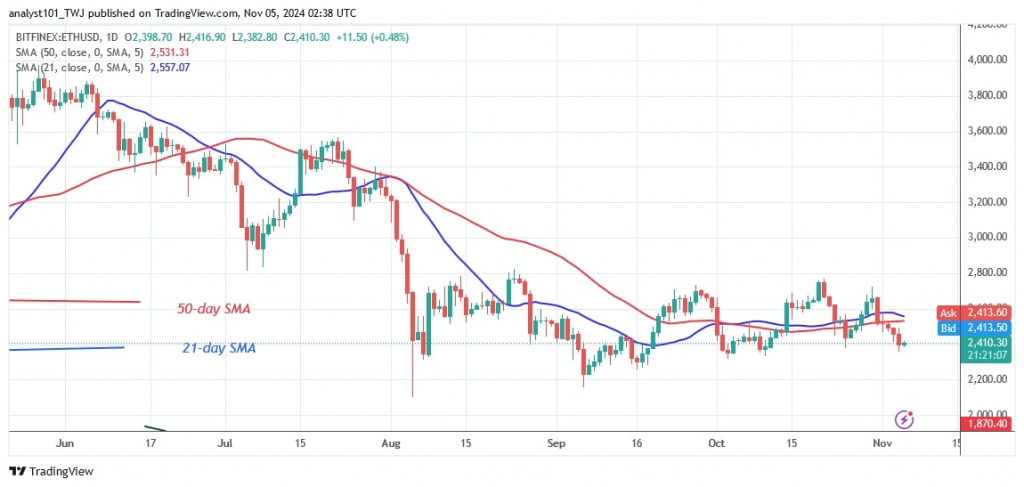
The price of Ethereum (ETH) has fallen below the key support line below the moving averages. Buyers have failed to sustain their bullish momentum above the overhead resistance of $2,800.
Long-term analysis of the ETH price: bullish
Over the past two months, the largest altcoin has encountered strong resistance at its recent high. Ether's price has fallen back to between $2,300 and $2,800. On November 4, the altcoin fell to a low of $2,360, but the bulls bought the dips.
On the downside, the bears will try to reach the low of $2,200. However, the bulls will endeavour to prevent the cryptocurrency from falling further. After the current decline, Ether is hovering above the support level of $2,400.
Analysis of the Ethereum indicators
The price bars have moved both above and below the moving average lines over the past two months.
Today, the price bars are below the moving average lines, indicating that the cryptocurrency will continue to fall. The emergence of doji candlesticks has led to a marginal change in price.
Technical Indicators:
Key resistance levels – $4,000 and $4,500
Key support levels – $3.500 and $3,000

What is the next direction for Ethereum?
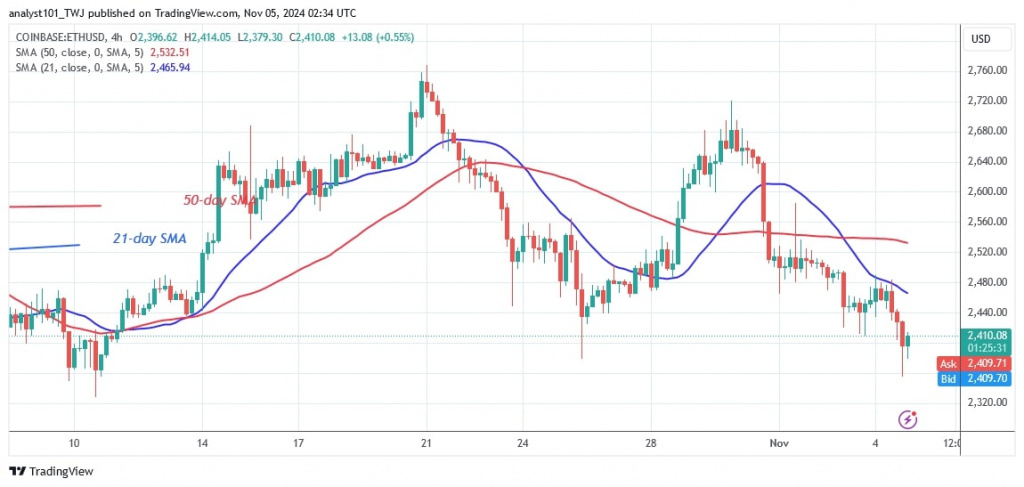
On the 4-hour chart, Ether has returned to its trading range but remains in the downtrend zone. The two extended candlestick tails point to the current support level at $2,300. The long candlestick tails at the $2,300 support level indicate strong buying pressure. Since September 16, the value of thealtcoin has fluctuated between $2,300 and $2,800, as reported by Coinidol.com before.

Disclaimer. This analysis and forecast are the personal opinions of the author. They are not a recommendation to buy or sell cryptocurrency and should not be viewed as an endorsement by CoinIdol.com. Readers should do their research before investing in funds.
Price
News
Price
News
Price

(0 comments)