Cardano Stops Above $0.95 And Continues Its Range-Bound Move
Updated: Jan 23, 2025 at 12:37

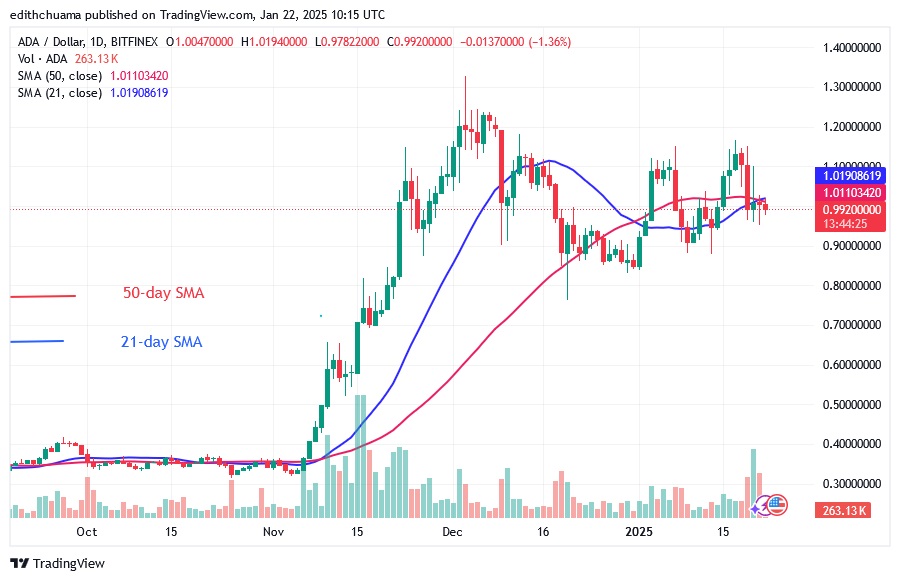
The latest price analysis by Coinidol.com report, the price of Cardano (ADA) is moving sideways after reaching resistance at $1.23.
Long-term forecast for the Cardano price: fluctuation range
The cryptocurrency is oscillating below and above the moving average lines. In other words, the altcoin's price range is between $0.80 and $1.20. On January 19, the negative trend broke through the moving average lines and continued to consolidate above the $0.95 support. Since January 19, the ADA price has been trading slightly below the moving averages. The price trend has stalled above the $0.95 support. Should the altcoin fail at its recent high, Cardano will fall above the $0.87 support.
Analysis of the Cardano indicator
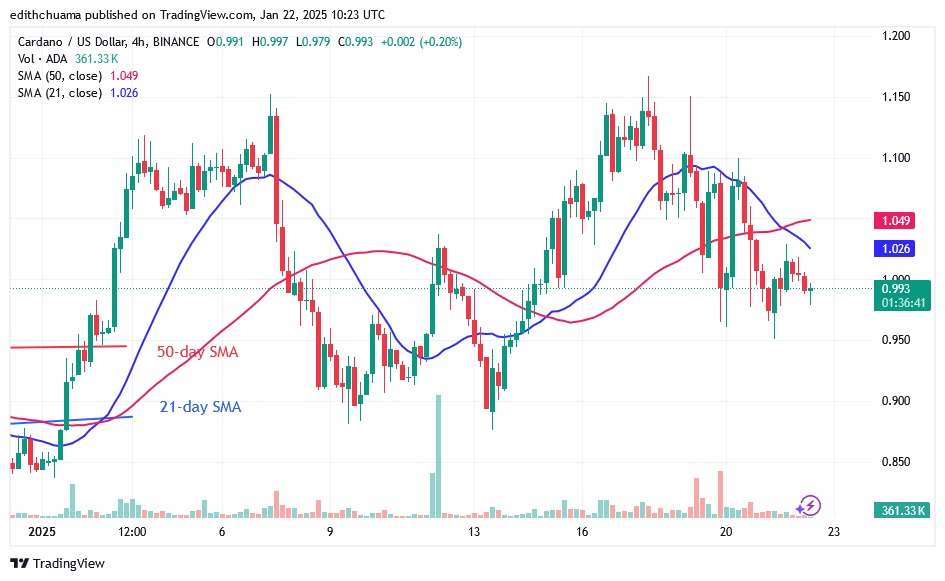
The price bars have remained consistent due to the presence of doji candles. The moving average lines are horizontal and correspond to the sideways trend. The 4-hour chart shows extended candlestick tails indicating the $0.95 support level. There is strong buying pressure near the $0.95 support level.

Technical indicators
Key resistance zones: $1.20, $1.30, and $1.40
Key support zones: $0.90, $0.80, and $0.70
What is the next move for Cardano?
Cardano is in an area below the moving average lines after a recent decline. On the 4-hour chart, the altcoin is trading above the $0.95 support but below the moving average lines. The price action has stalled above the $0.95 support, while the altcoin continues to move within the trading range.

Disclaimer. This analysis and forecast are the personal opinions of the author, are not a recommendation to buy or sell cryptocurrency, and should not be viewed as an endorsement by CoinIdol.com. Readers should do their research before investing in funds.
News
Price
Price
News
Price

(0 comments)