Cardano Falls To A Low Of $0.31 And Starts Its Range

The price of Cardano (ADA) has remained in a horizontal trend and is trading at the bottom of the chart.
ADA long term forecast: bearish
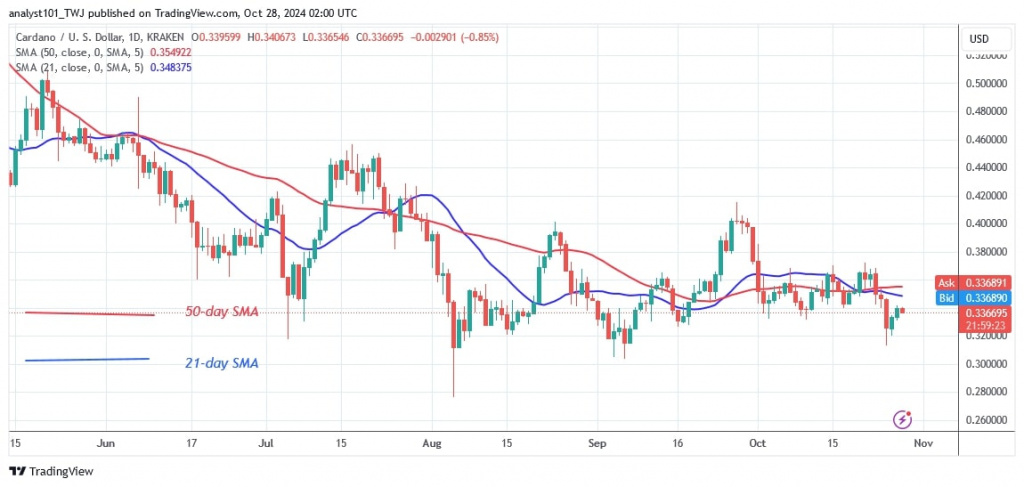
On October 25, ADA fell below the moving average lines and reached the low of $0.31. The altcoin has returned to its previous price range of $0.30 to $0.40. Further declines in the cryptocurrency seem unlikely.
However, if the bears break through the $0.30 support, the ADA price will return to the previous low of $0.27.
Today, the altcoin is trending upwards towards the moving average lines. The uptrend was rejected at the previous high. Cardano is currently worth $0.336.
Analysis of the Cardano indicator
The price bars have fallen below the moving average lines after the negative trend on October 25. Selling pressure has eased as the altcoin consolidates above the $0.30 support. The moving average lines are horizontal, with a bearish crossover. Doji candlesticks slow down the price movement.
Technical Indicators
Key Resistance Zones: $0.80, $0.85, and $0.90
Key Support Zones: $0.50, $0.45, and $0.40

What is the next move for Cardano?
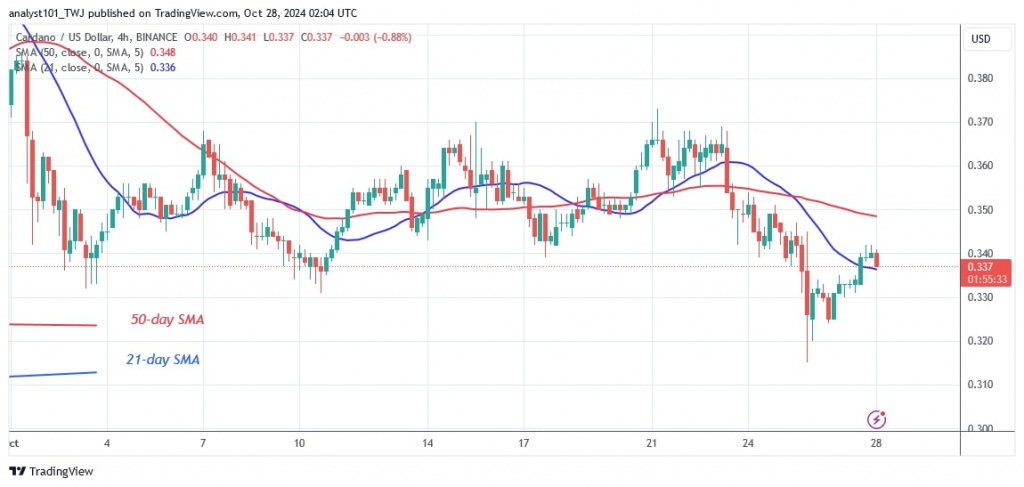
On the 4-hour chart, Cardano is in a sideways trend between $0.34 and $0.37. On October 25, the bears broke through the existing support and reached a low of $0.315. The ADA price corrected upwards to retest the previous support of $0.34. Cardano found resistance at $0.34 and continued its slide.
Disclaimer. This analysis and forecast are the personal opinions of the author. They are not a recommendation to buy or sell cryptocurrency and should not be viewed as an endorsement by CoinIdol.com. Readers should do their research before investing in funds.
News
Price
News
Price
Price


(0 comments)