Cardano Price Remains Stable And Holds Above The $0.57 Low

The price of Cardano (ADA) has been moving sideways since the end of the uptrend on December 13.
Long-term forecast for the Cardano price: bullish
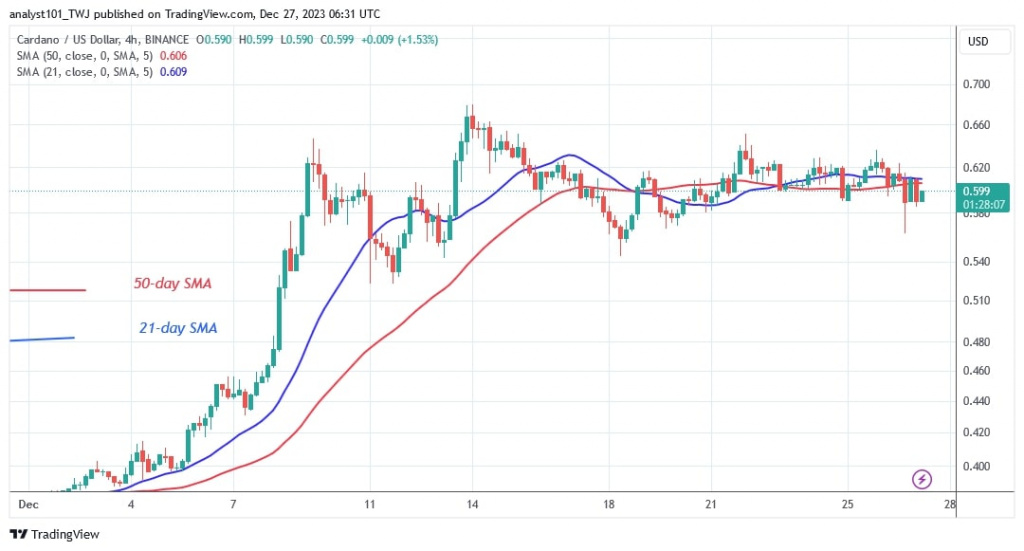
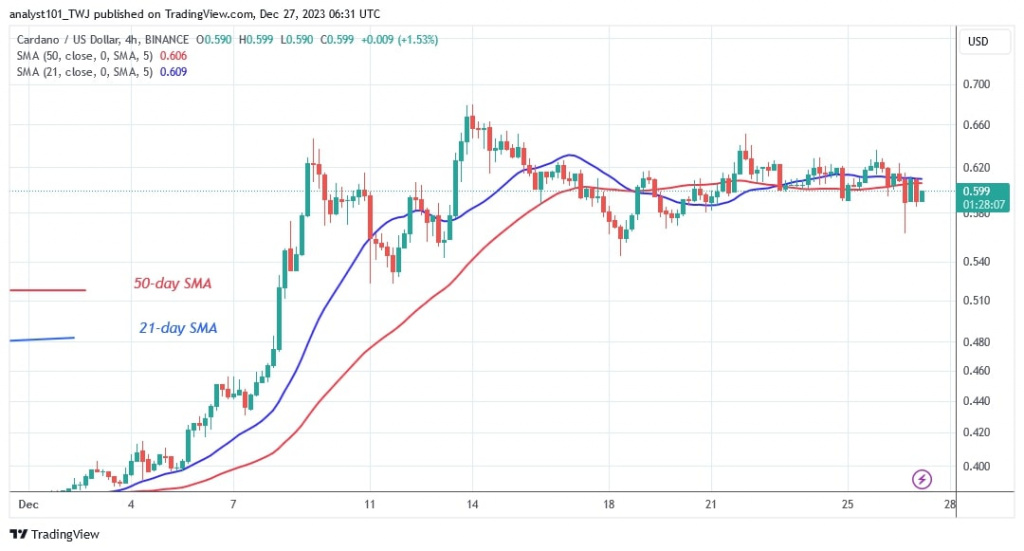
The cryptocurrency reached a high of $0.67 before being pushed back. Cardano was unable to break through the $0.70 resistance level. The altcoin is now trading above the 21-day SMA but below the previous high of $0.65. The barrier at $0.65 has further slowed down the upward movement. The altcoin is now trading between $0.57 and $0.66. The price movement has remained stable due to the doji candlesticks.
The price of the cryptocurrency is currently retesting the 21-day SMA. On the downside, selling pressure will increase again if the bears break above the 21-day SMA and the negative momentum continues. Cardano will fall above the 50-day simple moving average (SMA) or the low at $0.46.
Analysis of Cardano indicators
Cardano has remained solid as the bulls defend the 21-day SMA support. The cryptocurrency will fall if the bears break below the 21-day SMA. The moving average lines on the 4-hour chart are sloping horizontally, indicating a sideways trend. Doji candlesticks dominate the price action and limit the price movement.
Technical indicators
Key resistance zones: $0.50, $0.55, $0.60
Key support zones: $0.30, $0.25, $0.20

What is the next move for Cardano?
Cardano is currently trading in the bullish trend zone, with buyers keeping the price above the 21-day simple moving average. Price action is limited to the $0.58 to $0.65 range. Cardano will resume its uptrend if buyers break above the $0.65 and $0.70 resistance levels. The current trend will be halted if the bears break below the 21-day SMA.
On December 18, Cardano hit a low of $0.54 as bulls reacted to the declines. And on December 20, ADA/USD is trading at $0.58, as reported by Coinidol.com.

Disclaimer. This analysis and forecast are the personal opinions of the author and are not a recommendation to buy or sell cryptocurrency and should not be viewed as an endorsement by CoinIdol.com. Readers should do the research before investing in funds.
Price
Price
News
Price
Price

(0 comments)