Cardano’s Price Recovers, But Remains Stuck At The $0.53 Level
Updated: Feb 09, 2024 at 00:46

The price of Cardano (ADA) has resumed its positive momentum and has risen above the 21-day SMA. Price analysis by Coinidol.com.
Long-term outlook for Cardano price: bearish
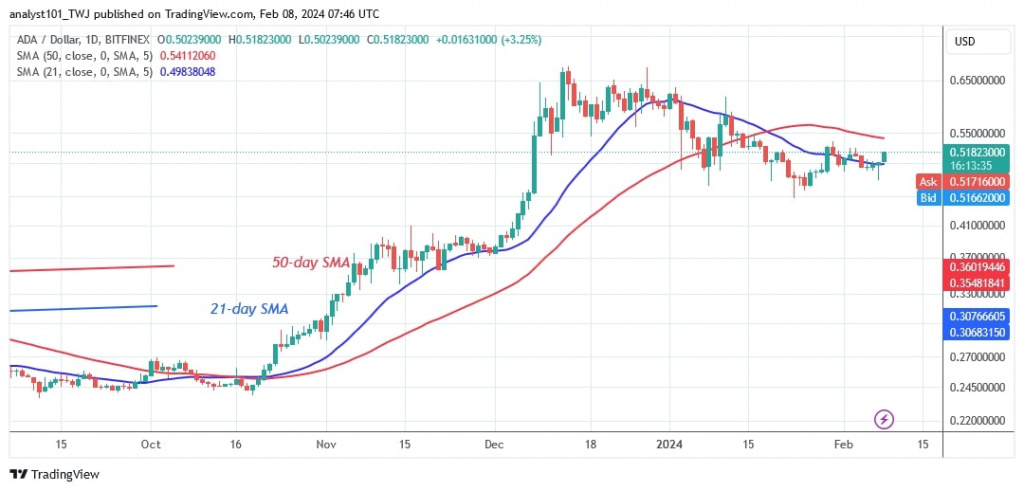
This is the second time that the price of the cryptocurrency has broken above the 21-day SMA since the price drop on January 23. ADA price is currently above the 21-day SMA but below the 50-day SMA. It is predicted that the altcoin will rise to the 50-day SMA. If the price breaks above the 50-day simple moving average, the uptrend will begin. The market will move higher and approach the previous highs of $0.60 and $0.67.
However, Cardano will be trapped between the moving average lines if the 50-day SMA stops the positive momentum. The altcoin will oscillate between the moving average lines over the course of the next few days. In other words, the altcoin will trade at prices between $0.48 and $0.56. The exchange rate between ADA and USD was $0.52 at the time of writing.
Cardano indicator analysis
The current price rise has pushed the price bars between the moving average lines. Cardana is caught in a range and will have to fluctuate for a few more days. The moving average lines are sloping horizontally due to the current sideways trend.
Technical indicators
Key resistance zones: $0.50, $0.55, $0.60
Key support zones: $0.30, $0.25, $0.20

What is the next move for Cardano?
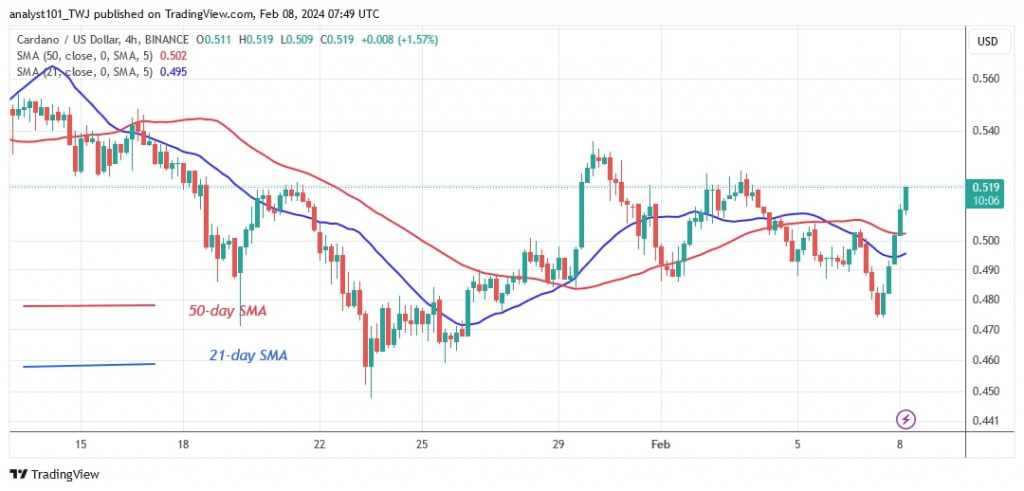
The 4-hour chart shows that Cardano's price has risen above the moving average lines. The altcoin rose to a high of $0.53 before being rejected. On January 30, the ADA price was halted at the same resistance level. The crypto price fell below the moving average lines.
The 50-day SMA and resistance at $0.53 need to be overcome by buyers to resume the uptrend in ADA/USD.
Coinidol.com reported a week ago that the price of Cardano (ADA) remained below the moving average lines but above the $0.48 support.

Disclaimer. This analysis and forecast are the personal opinions of the author and are not a recommendation to buy or sell cryptocurrency and should not be viewed as an endorsement by CoinIdol.com. Readers should do their research before investing in funds.
Price
Price
News
Price
Price

(0 comments)