Cardano Faces Resistance At $0.75 As It Pushes Forward

Cardano (ADA) has resumed its uptrend and broken above the $0.40 resistance level. Cardano has been trading sideways for the past three months, with support at $0.30 and resistance at $0.40.
Long-term ADA price forecast: bullish
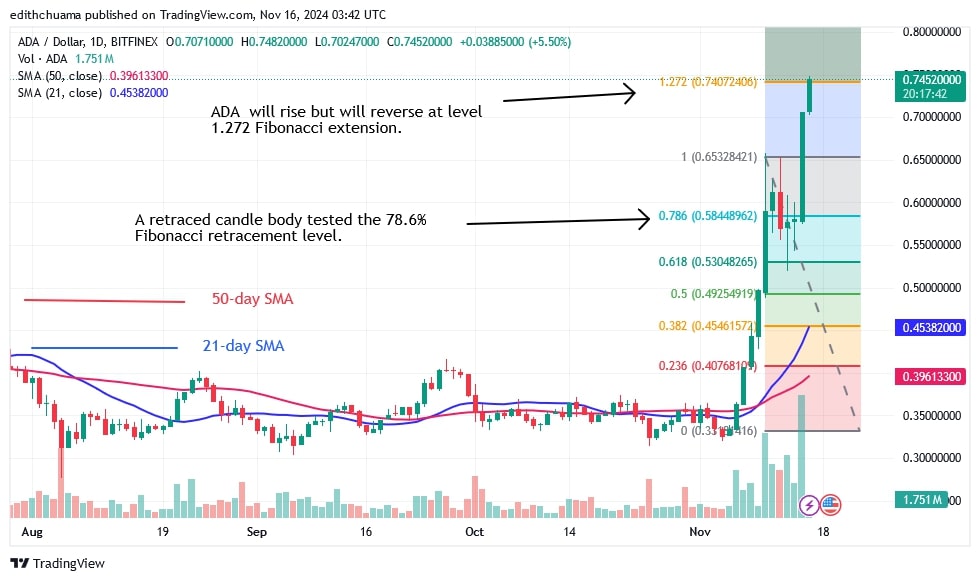
Today's upside momentum reached a high of $0.7480. On the uptrend from November 11, a declining candlestick body tested the 78.6% Fibonacci retracement level. The retracement predicts that the ADA price will continue to rise before reversing at the 1.272 Fibonacci extension or $0.7407.
The ADA price is currently approaching its high of $0.75. Cardano will rally to its highs of $0.78 and $0.80 if the barrier is breached.
Analysis of the Cardano indicators
The horizontal moving average lines are trending upwards in response to the current price rise. In addition, the moving average lines have formed a bullish crossover, indicating that the cryptocurrency will continue to rise. The doji candlesticks have disappeared since the breakout, indicating that the bulls have taken control.
Technical Indicators
Key Resistance Zones: $0.80, $0.85, and $0.90
Key Support Zones: $0.50, $0.45, and $0.40

What's the next move for Cardano?
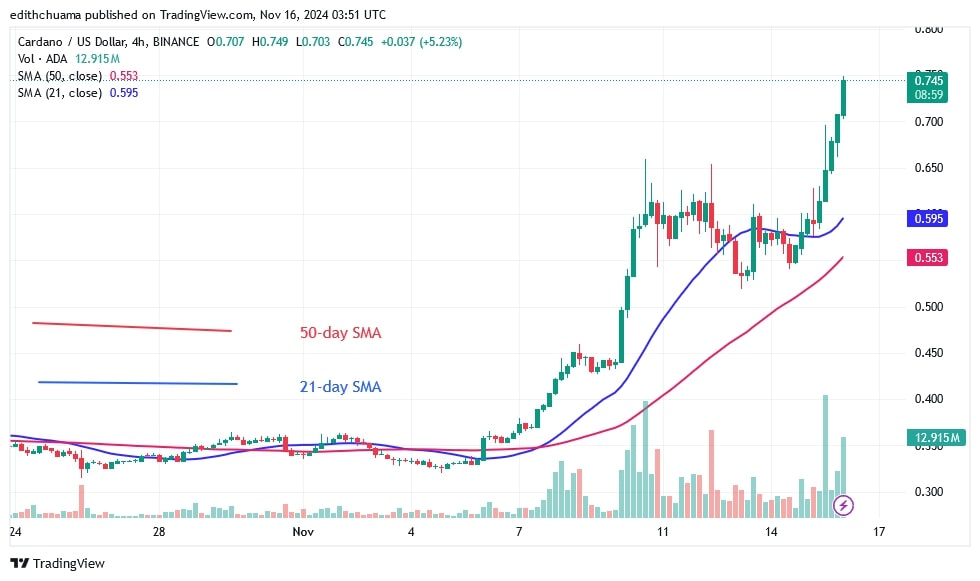
On the 4-hour chart, Cardano is in an uptrend after breaking through the $0.40 barrier. The upswing was paused at its high of $0.62 for a week before resuming. Today's rise has continued to a high of $0.7480. However, the uptrend could face resistance near the high of $0.75.

Disclaimer. This analysis and forecast are the personal opinions of the author. They are not a recommendation to buy or sell cryptocurrency and should not be viewed as an endorsement by CoinIdol.com. Readers should do their research before investing in funds.
Price
News
Price
Price
Price

(0 comments)