Cardano's Price Remains Stable, With Resistance At $0.39
Updated: Nov 30, 2023 at 10:38

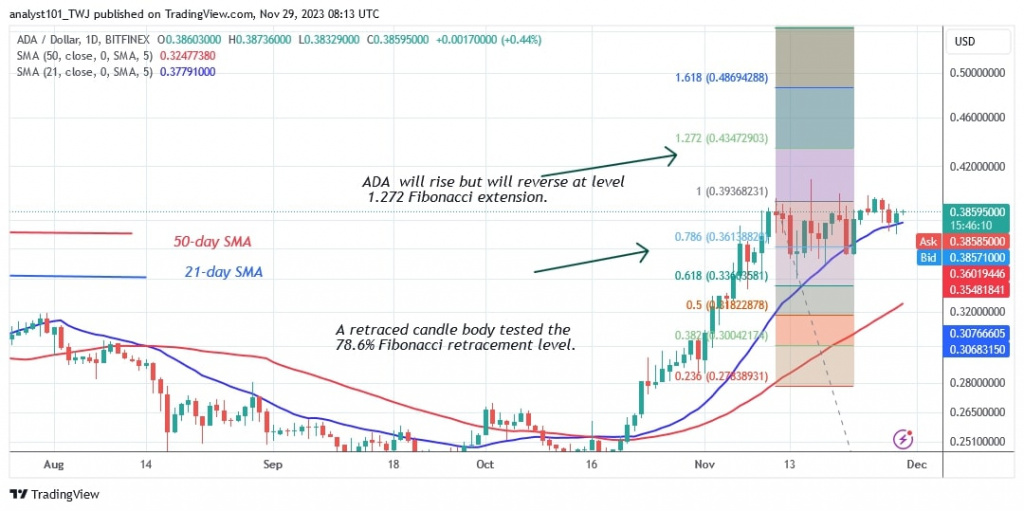
The price of Cardano (ADA) has been moving sideways since its high of $0.39.
Cardano price long term forecast: in the range
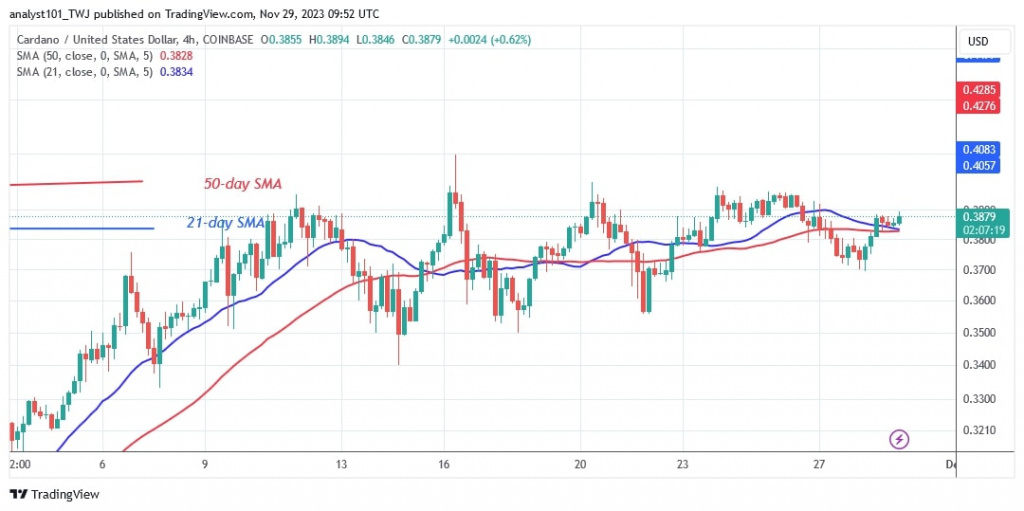
Cardano price is fluctuating below the resistance level of $0.39 while remaining above the moving average lines. The sellers tried to break below the 21-day SMA several times, but the bulls bought the dips. On November 27, the bears retested the 21-day SMA, but the bulls bought the dips. ADA price is rising to retest or break through the resistance level. At the time of writing, ADA/USD is trading at $0.38.
The altcoin is reaching the overbought zone of the market. If the bears break the 21-day SMA and the bearish momentum continues, the altcoin could fall. On the upside, the altcoin will face strong resistance at higher prices
Analysis of the Cardano indicators
The price bars for Cardano are close to the 21-day moving average line. The 21-day $MA provides support that has kept the current upswing going. The current upswing will end if the bears continue their negative momentum and fall below the 21-day SMA. The altcoin is likely to fall and find support at the 50-day moving average (SMA).
Technical indicators
Key resistance zones: $0.30, $0.35, $0.40
Key support zones: $0.20, $0.15, $0.10

What is the next step for Cardano?
The cryptocurrency has been in a sideways trend since November 11. Neither the bulls nor the bears have gained price control. As the market approaches the overbought zone, the bears are gaining the upper hand. The price of the altcoin remains between $0.35 and $0.40. The upward movement is further slowed down by the resistance level of $0.39.

Disclaimer. This analysis and forecast are the personal opinions of the author and are not a recommendation to buy or sell cryptocurrency and should not be viewed as an endorsement by CoinIdol.com. Readers should do their research before investing in funds.
Price
News
Price
Price
Price

(0 comments)