Cardano’s Price Fluctuates Around $0.49

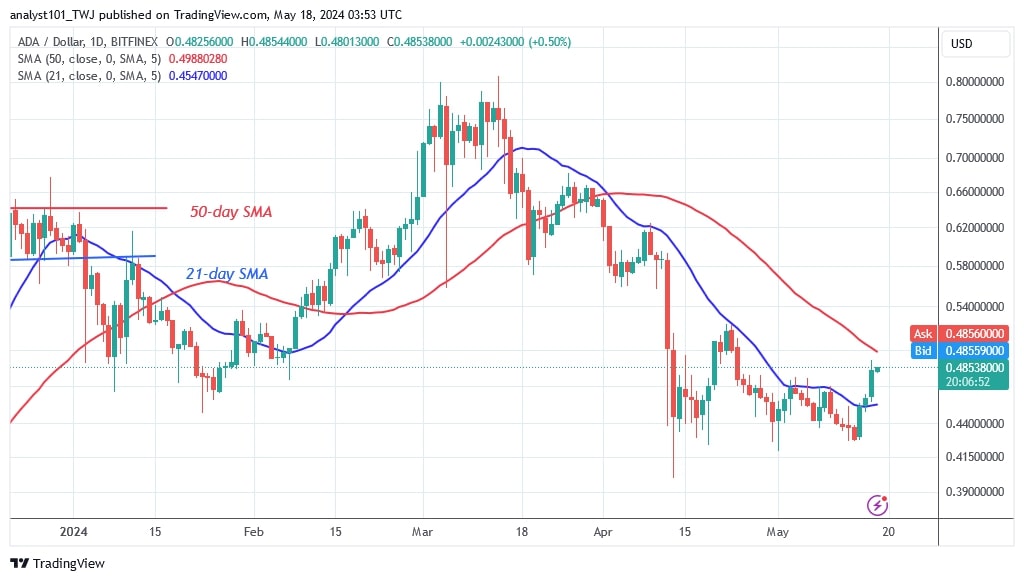
The price of Cardano (ADA) is rising after breaking above the 21-day SMA or resistance at $0.45.
Long-term forecast for the Cardano price: bearish
The altcoin is approaching the top of the 50-day SMA or resistance at $0.50. On the upside, Cardano will resume its uptrend if the current bullish momentum breaks above the 50-day SMA. The altcoin will reach highs of $0.62 and $0.68.
However, if it is rejected at the 50-day SMA, Cardano would be caught between the moving average lines. The altcoin will start to fluctuate between the moving average lines. In other words, the ADA price will fluctuate between $0.45 and $0.50. The current exchange rate between ADA and USD is $0.47.
Analysis of the Cardano indicator
Cardano's price bars have risen above the 21-day SMA but remain below the 50-day SMA. If the price of Cardano rises above the 50-day SMA, the negative trend will be stopped. The 21-day SMA had capped the previous uptrend but has now been breached. The buyers still have to overcome a barrier at the 50-day SMA before they can resume the uptrend.
Technical indicators
Key resistance zones: $0.80, $0.85 and $0.90
Key support zones: $0.50, $0.45 and $0.40

What is the next move for Cardano?
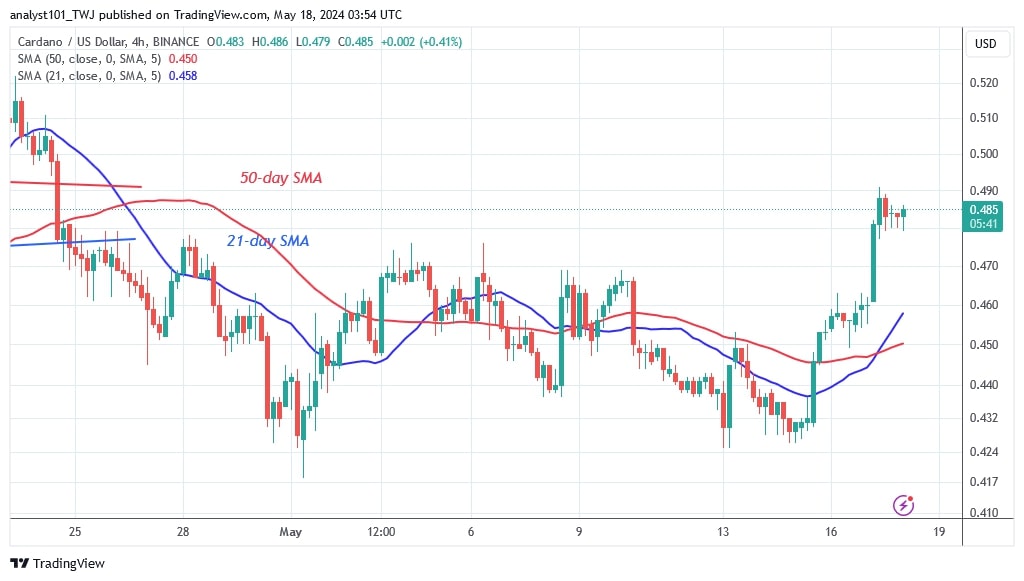
Cardano is bouncing as it approaches resistance at $0.50. On the 4-hour chart, the ADA price is stuck at $0.49. It is currently trading below its recent high, the cryptocurrency has tested the resistance level twice. This means that Cardano will fluctuate for a few days.

Disclaimer. This analysis and forecast are the personal opinions of the author and are not a recommendation to buy or sell cryptocurrency and should not be viewed as an endorsement by CoinIdol.com. Readers should do their research before investing in funds.
Price
News
Price
Price
Price

(0 comments)